A top down guide to the HQLA-gap

Coolabah Capital
We’ve previously published bottom-up technical notes on Aussie bank demand for government bonds, which is akin to a new form of quantitative easing or QE (replacing the RBA’s QE), and modelled how this demand evolves over time. This research quickly becomes very complex with multiple acronyms to contend with, including the CLF, TFF, NCOs, LCRs, HQLA and BPP. The bottom-up approach also needs to model changes in all the variables, which can quickly become confusing.
The purpose of this note is to offer a much simpler top-down framework for understanding Aussie bank demand for high quality liquid assets (HQLA) that meet APRA’s Level 1 classification. These assets include cash held on deposit at the RBA and government bonds.
The proposed framework can be distilled down to the concept that HQLA demand is driven by the growth in a bank’s Net Cash Outflows (NCOs) multiplied by its target Liquidity Coverage Ratio (LCR). NCOs reflect the bank’s estimate of the amount of money that would walk out the door in a liquidity shock. The target LCR is simply the ratio of HQLA to the estimated NCOs. Aussie banks generally target LCRs of 125-135%.
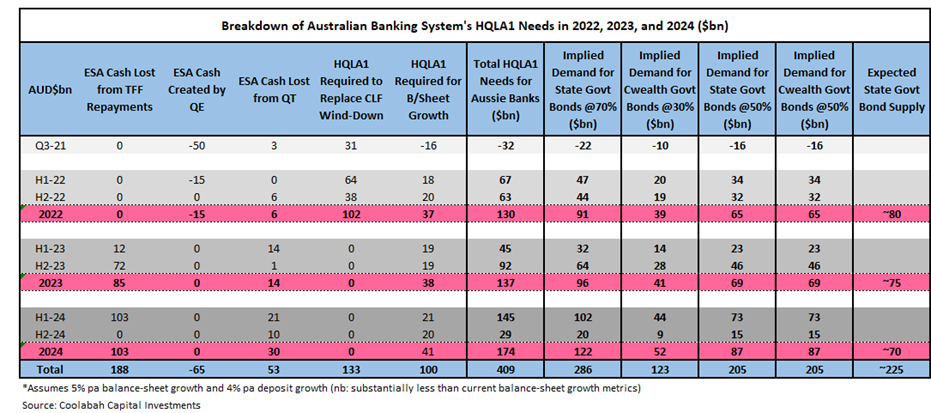
What we find is that this top-down framework provides a very similar estimate of total HQLA demand over the next 3 years to our bottom-up approach where we have modelled all the individual variables (ie, the CLF, TFF, HQLA, NCOs, LCRs and BPP). The top-down approach implies about ~$425bn of demand whereas the bottom-up approach points to about ~$400bn.
More detail
The removal of the $140 billion CLF (Committed Liquidity Facility), the repayment of the $188 billion TFF (Term Funding Facility) and the unwind of the RBA’s Bond Purchase Program (BPP) will directly drive increased Aussie bank demand for new HQLA to replace the liquid assets that banks will lose as a result of these three forces (ie, the TFF, CLF and BPP). Very simply, the closure of the CLF and the repayment of the TFF results in banks losing about $328 billion of liquid assets, all else being equal. Bond maturities and coupons payments boost things further.
Through the process of outlining these changes publicly, we have come to realise that the many acronyms obscure the simple point: that Aussie banks (also known as Australian Deposit Taking Institutions or ADIs) start this transition with small holdings of HQLA securities relative to their ultimate requirements.
It is this starting position that generates the demand surge as the acronyms unwind.
Under Australian banking regulations, ADIs hold liquidity as insurance against cash outflows. When they estimate cash outflows, they calculate how much money might walk in and out of the door in a stress event; the net of the inflows and outflows are called Net Cash Outflows, or NCOs. ADIs hold High Quality Liquid Assets (HQLA) in proportion to these NCOs. The ratio of High Quality Liquid Assets to NCOs is called the Liquidity Coverage Ratio. It follows that the product of NCOs and the target LCR is the required holdings of HQLA (required HQLA = NCO * target-LCR).
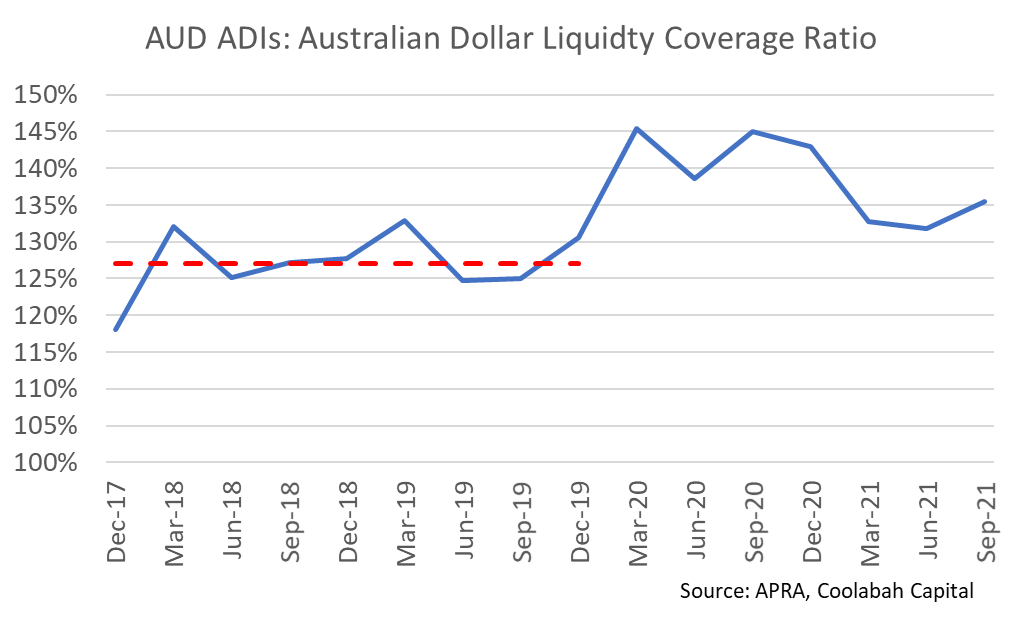
The regulatory minimum LCR for most institutions is 100%. These ratios are extremely volatile, so most ADIs will target a minimum LCR that is comfortably above the minimum. From 2015 to 2019, the average LCR for all ADIs (which is broader than banks) subject to this regulation has been ~125%, rising to 127% for 2017 to 2019. The all ADI LCR has been higher since 2020, mostly as a side effect of the RBA’s QE policies. Larger banks generally have board-mandated LCR targets of 125-135% as a buffer against LCR volatility.

The only assets that qualify as HQLA are Australian Government Bonds, Semis, cash (notes and coins) and deposits at the RBA (ES Balances). Up until recently, there weren’t enough qualifying assets, so the RBA and APRA created more via the CLF: the closure of this facility has been announced, and it will decline from 140bn in Q4’21 to zero in Q4’22. The RBA’s monetary policy has also created HQLA: both the Term Funding Facility and the Bond Purchase Program created ES Balances, which are included in HQLA. The TFF will be repaid as it matures (or likely a bit before it’s due), and ES balances will decline as the RBA’s Bond portfolio rolls off.
There are different views about how these things will proceed, but you don’t need fully worked out answers (though we have provided them, see here) to see the big picture. In the long run NCOs and target LCRs drive required holdings of HQLA; and HQLA stacks will be predominately made up of securities (ACGBs and Semis) – as all the acronyms roll off.
This
allows us to focus on the fundamental relationship: required HQLA = NCO * target-LCR.
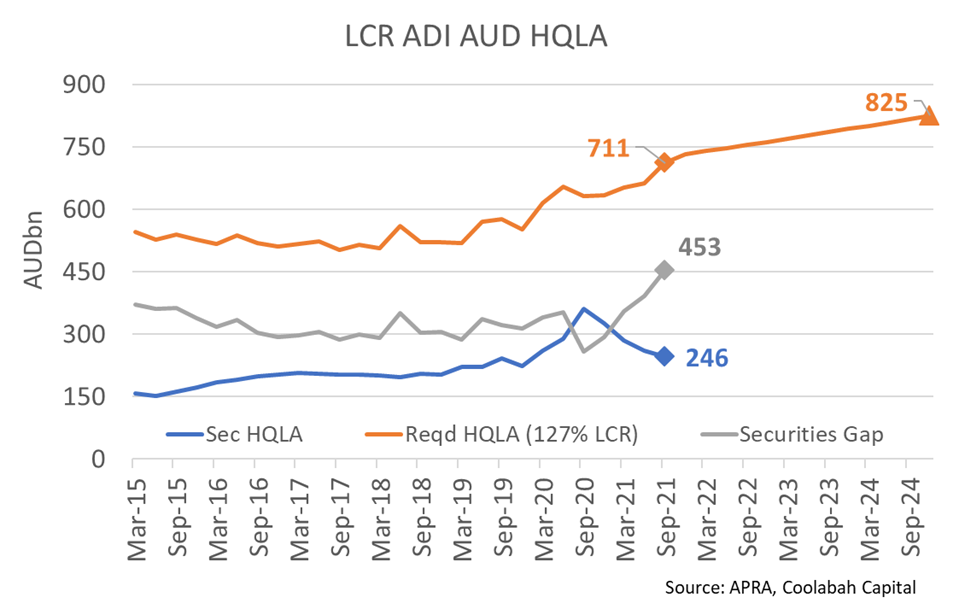
To frame the medium-term problem, we set the temporary things at their long run values (no CLF, 5bn excess ES balances). This shows that the system’s AUD HQLA-security shortfall was about 450bn in Sep’21. Major Bank Q4’21 updates suggest NCO growth of ~3%qoq; we assume this slows to 1%qoq over the outlook. We assume a target LCR of 127% (the 2017-2019 average), so every dollar of NCO growth ads $1.27 to the required holdings of HQLA securities. Thus, NCO growth adds a little over 110bn to required HQLA over the next three years.

Of course, there isn’t an HQLA gap at present: the CLF and currently swollen level of ES Balances make up the difference. The CLF, of 140bn, will go to zero at the end of 2022 and the repayment of the TFF, maturity of Bonds, and coupon payments will reduce ES Balances by around 275bn, to 145bn, by the end of 2024.
These high-level calculations show that that banks will have to find about 425bn of securities between now and the end of 2024 (required HQLA of 825bn, less current securities holdings of 246bn, less 145bn of ES Balances, and 10bn of notes and coins).
This fits closely with our more detailed, bottom up, estimates of 409bn to the end of 2024.

2 topics
5 stocks mentioned

Matt is a portfolio manager at Coolabah Capital, an asset manager than runs over $8 billion in fixed-income strategies. Matt has 17 years of experience on both the sell-side and buy-side. He spent most of his career (2008 to 2020) at UBS, the...

Matt is a portfolio manager at Coolabah Capital, an asset manager than runs over $8 billion in fixed-income strategies. Matt has 17 years of experience on both the sell-side and buy-side. He spent most of his career (2008 to 2020) at UBS, the...
