ASX copper stocks caught in Trump tariff turmoil as major broker turns bearish
Things are moving quickly in the copper market, and ASX stocks like SFR, CSC, FFM, MAC and AMI are getting caught in the crossfire.
Things move quickly in markets, and they move even faster in a Trump 2.0 universe! Just last week, I wrote an article on the copper market, including major broker views and technical analysis of the copper price.
The general view was one of modest upside in the copper price over the next few months as traders attempted to source all the copper they could find and send it to US warehouses ahead of a looming import tariff expected in the final quarter of the year.
The technical outlook, which I will update for you below, appeared to confirm both the prevailing strength in the copper price and, similarly, the modest upside. But themes that may have taken months to play out in boring-old pre-Trump 2.0 markets (aaahhh remember those!? 🤔) seem to play out much faster now.
Growing media speculation, and the tone of President Trump's speech yesterday, are firming the probability that a US import tariff on copper will be implemented in weeks, not months. This has sparked a little burst of chaos in the copper market, as well as a previously unwelcome reversal for the share prices of ASX-listed copper stocks.
Let’s investigate a very turbulent week in copper, the technical outlook, as well as Citi’s latest copper price forecasts (Hint: they’ve turned bearish!).
What a week for copper!
In my previous article, I explored major broker Citi’s perspective on copper, highlighting its anticipation of a tightening global market driven by supply constraints and robust demand. But the key driver of Citi’s assumptions – as is the case for most of the research community – is a potential 25% Section 232 tariff on US copper imports.
Initially pencilled in for Q4 2025, the looming tariff was causing many copper traders to frontload their shipments into the US, therefore tightening demand elsewhere and triggering the surge in the copper price since February (see chart below – and note that I picked that surge! 💪).
However, that Bloomberg article, as well as growing rhetoric on a stronger and not weaker tariff stance from President Trump in comments this week, has caused Citi and others to revise their outlooks – and that’s triggered both a spike and blowoff in the copper price over the last few days.
Citi turns bearish
The prospect of an earlier-than-expected 25% tariff in Q2 2025 has upended prior assumptions about physical market dynamics, particularly the window for arbitrage and export flows. Traders suddenly believed they needed to get their work done sooner rather than later – so we saw a sharp spike in the COMEX copper price on Tuesday afternoon and into Wednesday.
The risk now, says Citi, is that with the timeline having been compressed, the opportunity for copper arbitrage has faded. This is being reflected by narrowing discounts in near-dated arbitrage spreads (e.g., May/July contracts) compared to later months.
The broker now expects the 25% U.S. copper import tariff to take effect sometime in the next three months, closing the door on further significant frontloading of US-bound copper shipments. This adjustment has led Citi to turn “near-term bearish” on ex-US copper pricing, revising their 0-3 month price target from US$10,000/t to US$9,500/t.
It gets worse. The broker suggests “a broader unwind of physical demand” and “growth headwinds” for the US economy resulting from President Trump’s broader US import tariff strategy, would cause a further easing in the copper price – to average US$8,800/t through the second half 2025.
To put this into perspective, the price of copper was trading at US$9,982/t on the London Metals Exchange (LME) prior to this week’s abrupt shift in market sentiment (Tuesday), and it closed at US$9,787 yesterday. If Citi’s new forecasts are correct, then there could be as much as 10% downside in the LME copper price by the end of this year.
Copper chart technicals confirm short-term blow-off potential
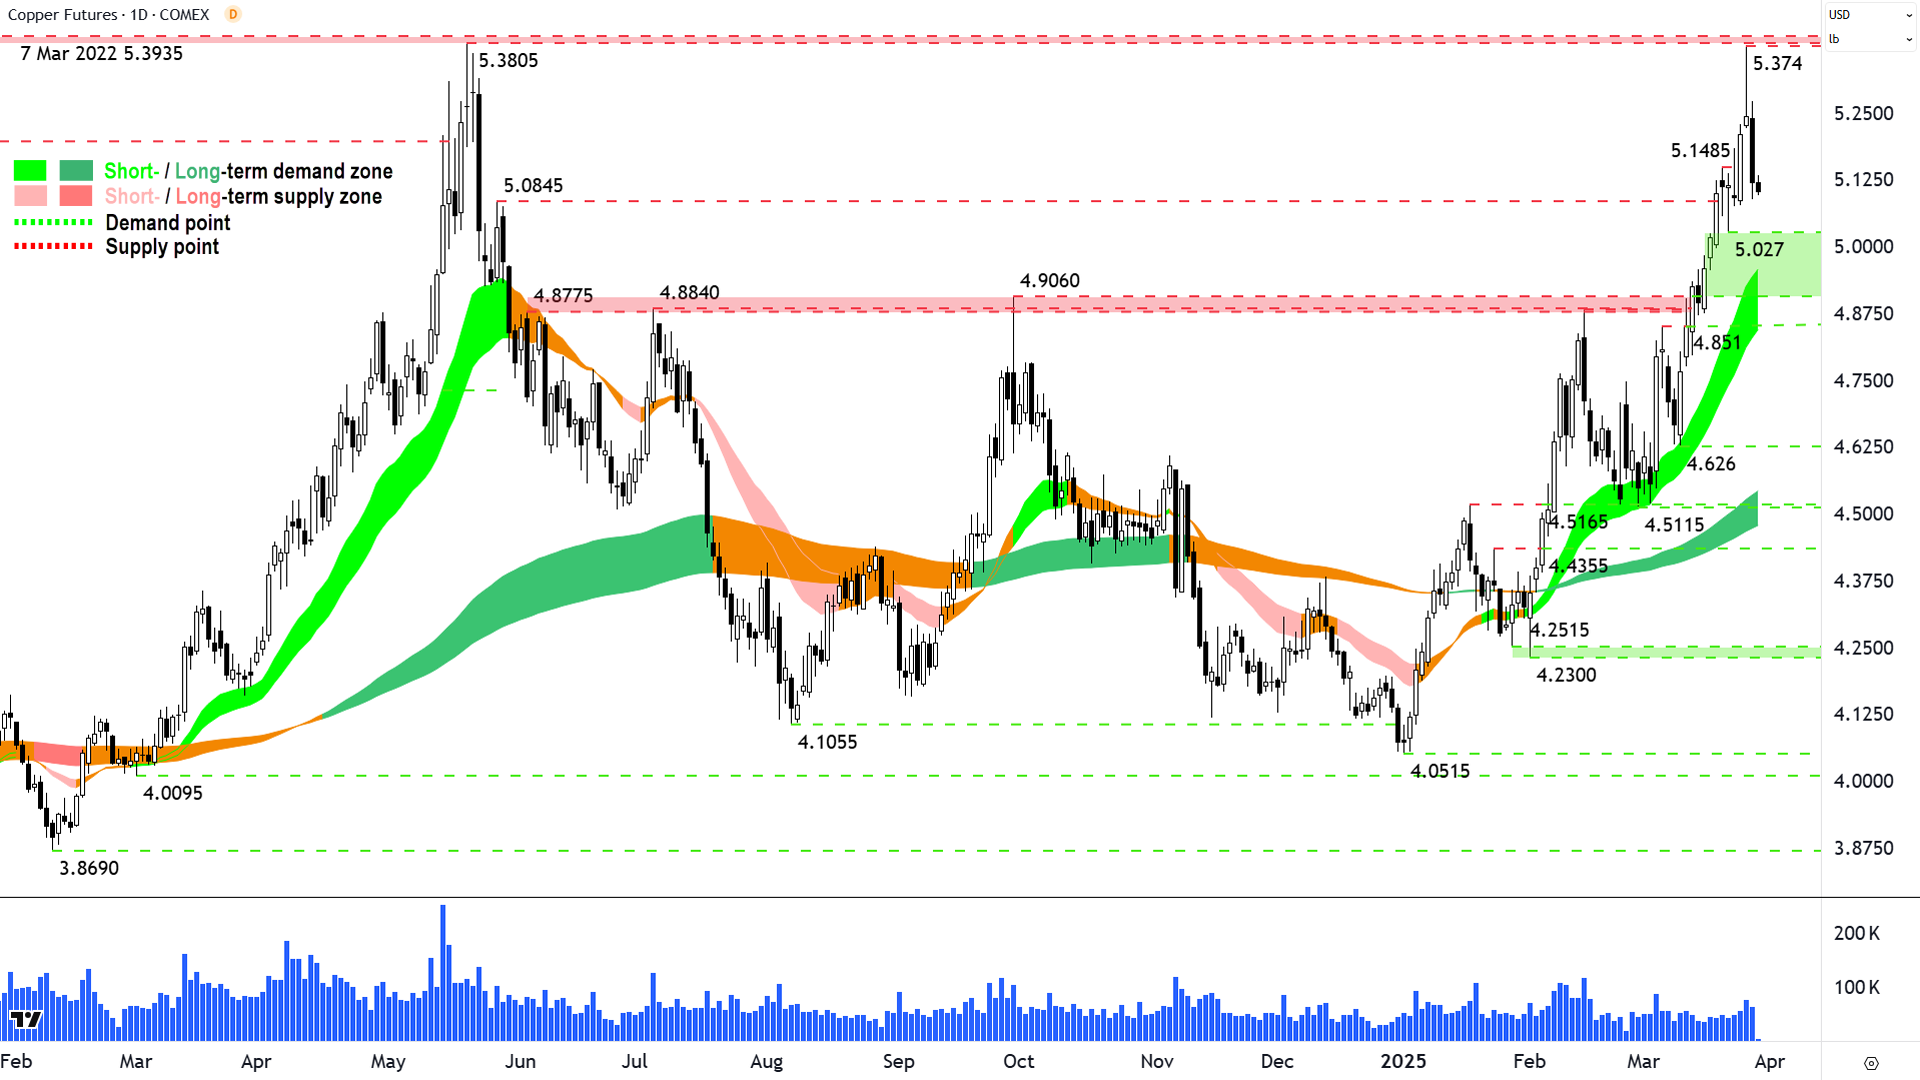
I track the COMEX copper price very closely in the ChartWatch section of Market Index’s Evening Wrap. I turned bullish on 6 February this year, and have more for most of the time since then been working off a final potential target of 5.3805-5.3935.
As can be seen in the chart below, that target was achieved as the market responded to the media speculation that the US import tariff on copper would be implemented sooner rather than later. The 26 March candle, with its long upward pointing shadow topped at 5.374, reversing intrasession to close at 5.243.
%20COMEX%20chart%2027%20March%202025.png)
%20COMEX%20chart%2027%20March%202025.png)
Upward pointing shadows in candle analysis point to areas of excess demand. Remember – the only way to form such a shadow is if the price is advancing earlier in the session. It implies that the demand that was FOMO-ing (fear of missing out!) into the market was met and then overwhelmed by a wall of excess supply in the system.
Such a strong signal, at such a critical potential zone of supply – is a clear marker for technical traders to switch from the demand-side to the supply-side of the market. It is therefore no surprise to me, at least, that the 27 March candle was a follow-through supply-side-controlled candle with a long black body and a close near the low of its session.
The likelihood we have reached at least a temporary equilibrium point in the copper market has increased markedly – but this doesn’t automatically imply a top. Reaching equilibrium simply means there is more likely to now be more active and motivated supply in the market to meet what remains clearly (from prevailing trends and price action) still a very demand-side oriented market.
As a technical trader, much of the job is done in terms of making that February-to-target trade. I will now await confirmation of whether the demand-side can regroup, soak up any profit taking around here (as well as speculative shorts), and re-establish the prevailing short and long-term uptrends.
This will come in the form of the holding of key demand levels such as the short term uptrend (approx. 5.00) and the static zone of demand at 4.906-5.027, but also with the appearance of strong demand-side candles (i.e., white-bodied and or downward pointing shadows), and the continuance of rising peaks and rising troughs.
Alternatively, if I were to see the opposite of the above, for example, a close below the aforementioned levels of demand, the appearance of strong supply-side candles (i.e., black-bodied and or downward pointing shadows), and the setting of lower peaks (initially) and then lower troughs) – I would grow more concerned about a reversal in the copper price, potentially akin to that experienced in May-June last year.
Undoubtedly, that massive reversal will be playing on traders’ minds, and therefore caution from here is warranted. Mine is a very reactionary form of technical analysis – trend following – not trend prognosticating. So, whilst I see reason to move to a more neutral stance on copper for the next few sessions, there is little else so far to lead me to doubt the strong prevailing short and long-term uptrends.
Want more of Carl’s technical analysis? Stay tuned to his ChartWatch updates in our Evening Wrap, as well as his daily ChartWatch ASX Scans where he publishes his favourite uptrends and downtrends for ASX stocks and ETFs. Also, if you're after technical analysis of ASX copper stocks, check out this article where the analyses 13 of the biggest!
This article first appeared on Market Index on Friday 28 March 2025.
Never miss an update
Enjoy this wire? Hit the ‘like’ button to let us know.
Stay up to date with my current content by
following me below and you’ll be notified every time I post a wire
Carl has over 30-years investing experience and has helped investors navigate several bull and bear markets over this time. He is a well respected markets commentator who specialises in how the global macro impacts Australian and US equities. Carl has a passion for technical analysis and has taught his unique brand of price-action trend following to thousands of Aussie investors.
........
Investing is risky. Inevitably you will endure losses. If you can't cope with losing, don't invest.

Never miss an update
Get the latest insights from me in your inbox when they’re published.
5 topics
13 stocks mentioned

Carl has over 30-years investing experience and has helped investors navigate several bull and bear markets over this time. He is a well respected markets commentator who specialises in how the global macro impacts Australian and US equities. Carl...
Carl has over 30-years investing experience and has helped investors navigate several bull and bear markets over this time. He is a well respected markets commentator who specialises in how the global macro impacts Australian and US equities. Carl...
Comments
Comments
Sign In or Join Free to comment