Why keeping some powder dry is critical right now
In a recent piece looking at asset allocation within the credit sector, we looked at how alternative credit strategies have materially improved both portfolio return and volatility vs bonds in recent years. We’ll continue this focus on the credit sector with pieces today and later this week.
In this two-part series on Credit and Distressed sectors, we begin by looking at the progression of a typical credit cycle, as well as how today’s markets fit into that timeline. It is probably easy for us all to forget what a credit cycle is; after all, it’s been 15 years since we’ve seen the last one. We accept that this cycle is unique, but also know that the general pattern rhymes with history, and as such, lessons can be learnt. The 2008 Global Financial Crisis is the latest such example, and prior to then were the cycles of 2001 and 1991. In the interim period we have had a number of hiccups which threatened to look like a fully-fledged cycle, these include:
- Sector-focused disruption with the Energy meltdown in 2015-16; at the time Energy was the largest single sector exposure in the US high Yield (HY) market;
- Regional-focused disruption with the European debt crisis in 2011 and more recently the Chinese real estate bubble popping over 2022-23;
- COVID induced pandemic and shutdown of swathes of the economy most clearly affecting bricks and mortar retail plus the travel/leisure industry.
Often these mini-cycles are difficult to predict, yet traditional systemic cycles present a far more robust opportunity set and have longer lasting impact.
In this piece we’ll be looking at traditional credit cycles and where we might be currently, and in our following piece, we’ll share our allocators playbook and roadmap, outlining how investors might dynamically shift exposure in their credit and broader portfolios to achieve the best risk-reward profile available. Finally, we will look at some trade examples across the spectrum of Credit and Distressed strategies, such as some technical aspects of the levered loan market which we believe is starting to create opportunities.
The Credit Cycle
A typical credit cycles involves:
- Buildup in excess and leverage ·
- Monetary policy tightening response ·
- Credit conditions tightening ·
- Retrenchment at the corporate (and household) level ·
- Defaults climb.
In the years (or even decades) leading up to a default cycle, leverage and excess builds up in the system. Typically these periods are characterized by low interest rates, low lending standards and requirements, and a high availability of credit. While bubbles sometimes appear obvious in real-time (such as with high-growth tech), there are always hidden pockets of leverage that aren’t clear until after credit conditions tighten. In order to stem the overheating, Central Banks raise rates, and during this initial phase of contraction, markets tend to be range bound and perform acceptably as the economy and earnings hold up. These rate hikes tend to take time to filter through the economy, eventually credit conditions tighten as banks struggle with an inverted yield curve, forcing lending standards to tighten over concerns of higher risk of borrower default, after which the economy tends to soften as credit issues pop up. This next stage is the negative feedback loop from credit to the economy back to credit back to the economy. Corporates and consumers cut back at the margin. This cutting always occurs with the low hanging fruit to start with, but eventually leads to jobs if the negative feedback loop is sufficiently powerful enough. This retrenchment weakens the economy and thus earnings, which pushes corporate leverage even higher, as the denominator in debt/EBITDA drops. Margins are simultaneously compressed from the bottom line by other cost pressures such as labor, energy, or raw materials, and from the top line by falling revenues. As a result, credit quality weakens further, bank portfolios deteriorate and non-banks suffer portfolio stress, which leads to more credit tightening and yet further cost cutting. Unemployment tends to jump higher. The final stage is a rise in defaults at the same time as rising unemployment forces Central Banks to take action, in order to break the negative feedback loop - cutting rates, often in an aggressive fashion and steepening the yield curve. So where are we today?
Driven by a decade of low (often zero) rates policy, we have noticed various excesses and a buildup in leverage.
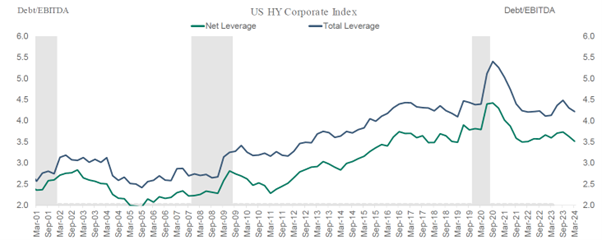
HY leverage remains elevated despite having come down right after the pandemic:
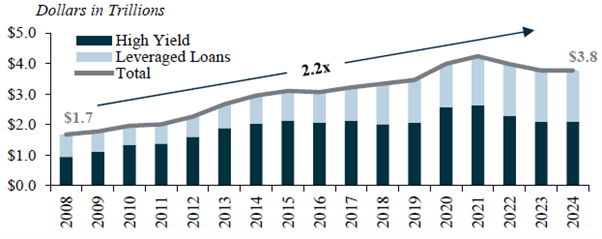
At the same time the size of the global leveraged finance market has grown 2.2x since 2008:
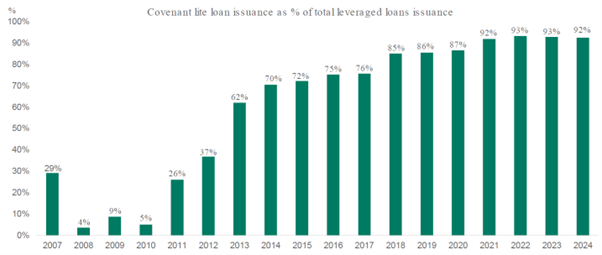
The low rates environment has fueled a search for yield in a borrower friendly market, resulting in the leveraged loan (LL) market becoming almost entirely covenant lite:
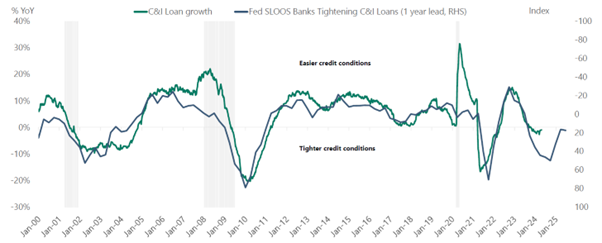
In the summer of 2022 headline CPI reached levels not seen in 40 years. This was after the Fed characterized the initial rise in inflation as transitory (a policy mistake), allowing inflation to build further and gain momentum. In response, Central Banks globally in developed markets (barring Japan) raised rates aggressively to quash this inflation impulse. Lending standards have tightened, and accordingly we are seeing banking lending shrink:
This is starting to feed through to corporates, as the higher cost of capital, driven by higher base rates, weighs on earnings and interest coverage ratios, which have been coming down. Similarly, rising consumer delinquencies, such as auto and credit cards is noted:
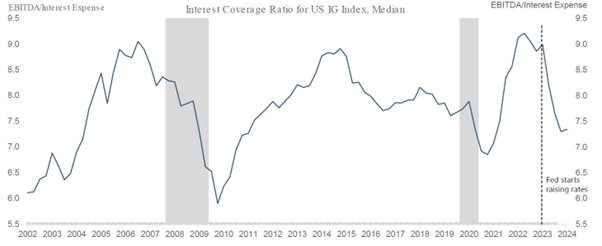
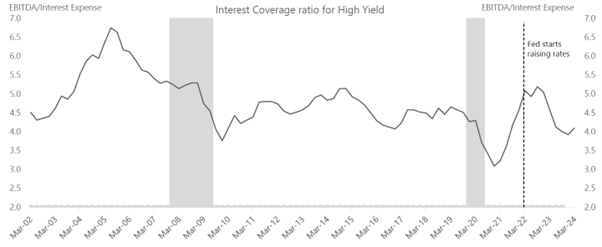
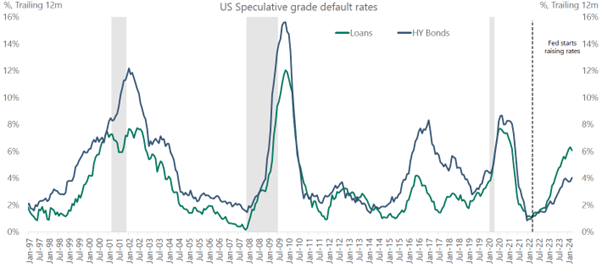
Already we are starting to observe signs of an uptick in defaults, currently just a trickle and comparable to the 2015/16 energy sector focus levels. The cycle for defaults has really only just begun, and this tickle could turn into a flood in the coming months:
Conclusions
Leverage/excesses can build up due to low rates for a long time. The Fed has hiked (this time rapidly) to slow the overheating, and credit conditions have begun tightening, first slowly and now more quickly. The next step is for tighter credit conditions and weaker credit demand to continue to filter into the real economy as corporates and households pull back. This negative feedback loop is typically halted when the Fed finally panics. The risk is that they are slow to do so in this cycle, given their intense focus on inflation. The Fed pivot at the end of 2023 has likely eased the situation, but only prolonged the negative feedback loop stage of the cycle.
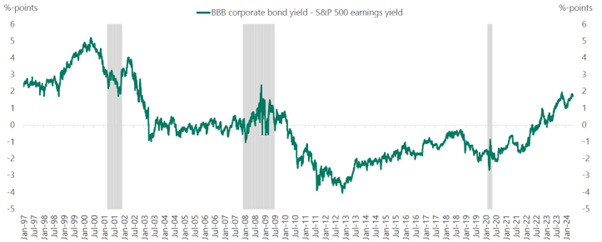
Today we advocate patience when considering Credit and Distressed, knowing that funds are being paid (noted below) to wait for the zenith of the distressed/defaults opportunity set.
We believe it is prudent to not chase these opportunities, and only seek funds which will participate in situations where securities are trading below their intrinsic value with multiple ways to generate positive outcomes. This cycle will create good opportunities, and we believe clients should make sure they have the (free) capital to invest as they arise. In our subsequent article we provide our playbook from an allocators perspective on how to shift portfolio exposures to achieve optimal risk-return characteristics.
5 topics

