Have investors been valuing stock markets wrong?
As Livewire's "economics whiz" (not my words, the words of my colleague Ally Selby), I don't mind going out on a limb suggesting that the economy of decades ago is not the same as the economy of today.
For instance, houses were, without question, difficult to attain at 17% interest rates in 1990. But house prices, household indebtedness, and the demand-to-supply ratio have all soared in the last 34 years at a rate that far outpaces income growth. A 4.5% interest rate from the Reserve Bank has a very different impact from yesteryear.
And just as the economy has changed dramatically, so has the stock market. Gone are the days when Exxon Mobil, General Electric, and AT&T ruled the top five companies.
Today's Magnificent Seven possess all of the traits required to be a quality stock, all have exposure to the next great mega-trend (artificial intelligence), and all are extraordinarily expensive. In turn, their weighting and influence on the wider market have also made the S&P 500 one of the most expensive stock markets on the planet.
Or... is it?
A recent note from Scott Chronert, US equity strategist at Citigroup, suggests that the S&P 500 is not as expensive as you might think. Are valuations stretched? Without question. But it doesn't mean that the market is too expensive to jump in - in fact, it makes every pullback both welcome and a buying opportunity.
In this wire, I'll take you through Chronert's logic and explain why his piece may be a timely reminder to discuss what "expensive" means in today's market.
Index P/Es versus single stock P/Es
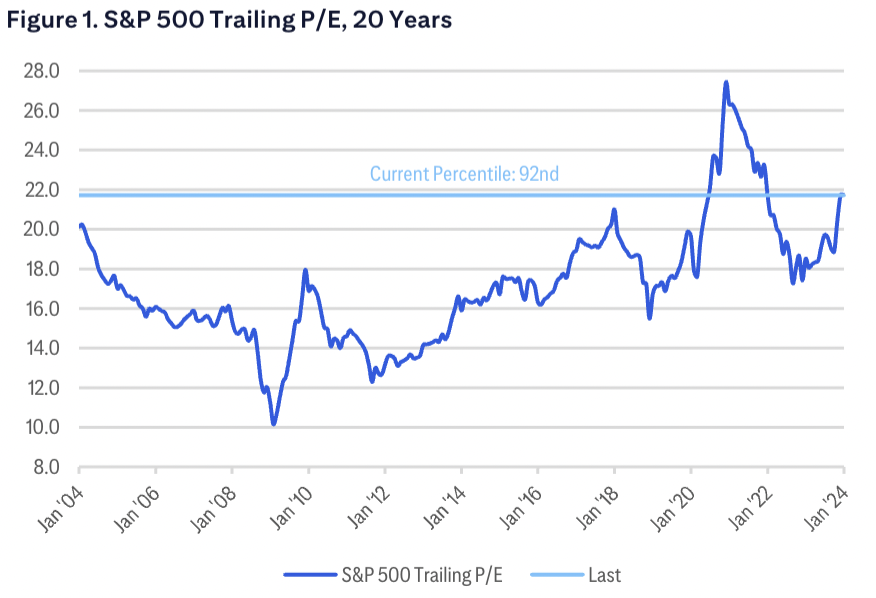
If you were to value the stock market the old-fashioned way, you would see that the S&P 500 is trading on 22x trailing earnings. Put another way, the S&P 500 is trading at its 92nd percentile - meaning the current valuation of the index is higher than it has been 92% of the time (in this case, the last 20 years).
Or to use a highly technical term - it's expensive!

But unless you are investing in an index-tracking ETF and you are willing to accept that just seven stocks now make up nearly 30% of the said index in the process, chances are you will be more interested in an individual stock or sector's price-to-earnings ratio. For instance, big tech firms have had a higher P/E ratio but that's because many of these firms have quality earnings and a lot of expected earnings growth embedded in the price.
This brings me onto another tangent - a P/E ratio is not always the best measure for a single stock or a single sector either.
Citi calculates that only 60% of the S&P 500's constituents are valued on P/E - the other 40% is better valued by other metrics like a price-to-book (P/B) or EBITDA for banks and retail businesses respectively.
Valuing the whole market through just one metric or lens, Chronert argues, is a fool's game.
"Sector contributions to index market capitalisation are different from sector contributions to index-level earnings. Specifically, Information Technology contributes more to the index price action than it does to earnings.
On the other hand, Financials and Energy are more important drivers of index earnings than they are to index price action," Chronert said.
One last note about the above chart is that it focuses on trailing P/E ratios. The only problem with this is that the E portion (earnings) is in the past and the P portion (price) is an educated guess based on where valuations will be in one year, two years, or however many years your time horizon is.
The different ways to value an index's existing constituents
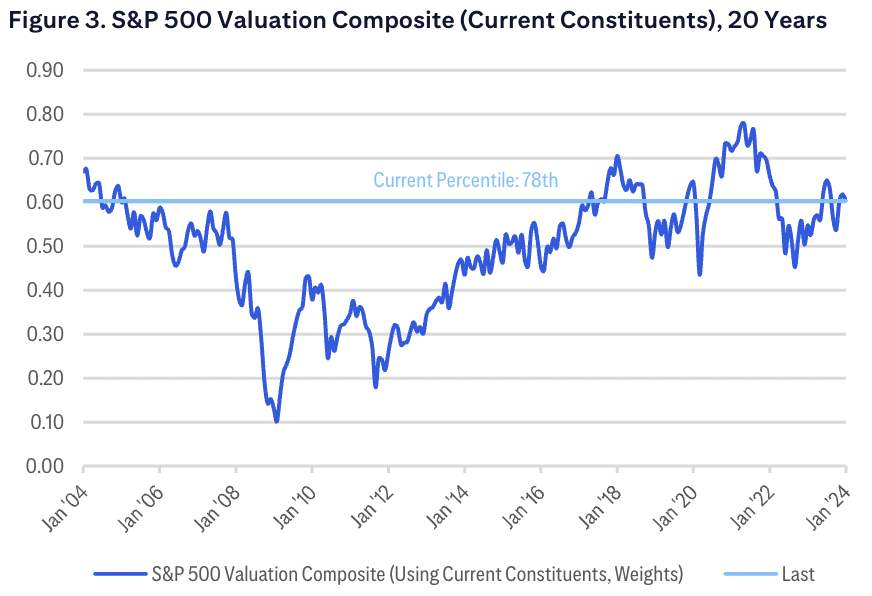
Citi proposes a bottom-up approach to valuing an index. That is, value every stock and sector by the method that makes the most sense to each stock and sector - then add it all together. Their method spits out a far different figure - 19.1x earnings (or the 78th percentile).

In other words:
"We acknowledge investor concerns that S&P 500 valuations look stretched. However, our bottom-up approach shows the situation to be less concerning than headline valuations would imply," Chronert wrote.
"Our call has been that the Q4 2023 rally essentially priced in some amount of soft landing sentiment (and fundamental growth expectations). In turn, that sets up a view that pullbacks should be expected, and bought into, with an eye toward a better risk/reward opportunity as we navigate ongoing macro risks and an eventual Fed pivot," Chronert added.
They also argue that there is a near-zero correlation between a traditional trailing P/E ratio and one-year forward returns - or put another way, a traditional P/E ratio is a weak indicator for short-term returns. However, there is a better correlation between the percentage of undervalued (low P/E stocks) and returns.
That means that if we are entering a new stock market up-cycle, you'll want to focus on deeply undervalued stocks to generate outperformance. This is an approach that has been used by such fund managers as L1 Capital - and their Long Short Fund's 3-year net return is 15.3%!
American equities are pricey but does that make Australian stocks cheap?
The short answer is not necessarily.
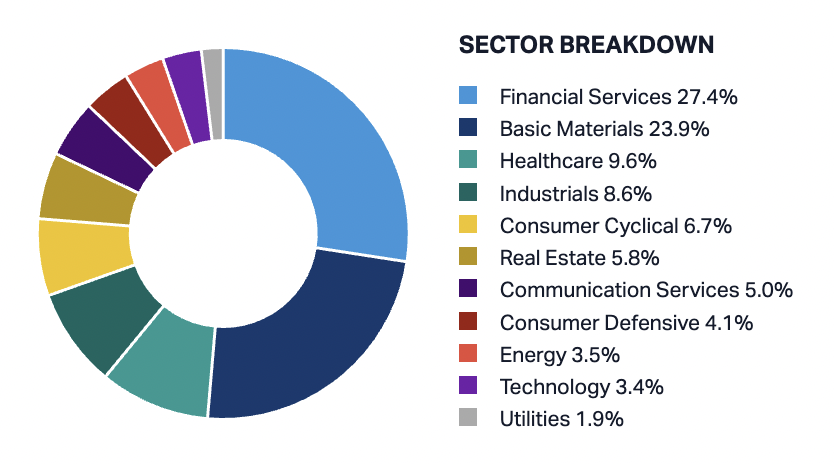
Australia appears to be cheaper at the index level simply because there is a greater composition of low P/E stocks. Think about it - resource and financial companies generally have a lower P/E ratio because they are focused on dividends and earnings stability given any number of macro headwinds that could blow forecasts into the water. These two sectors alone make up more than 50% of the market.

Australia also has a relatively small technology sector which also makes up a small percentage of the index. And even though healthcare is the third-largest individual sector, it's still only 10% of the total index's weighting.
The ASX 100 is currently trading on roughly 17x trailing earnings. While you might think that's well above the long-term average of 15.7x, it is well below where we hit during the peak of the COVID-19 crisis (20x earnings roughly).
A big thank you to my colleague Carl Capolingua for his help. Carl also wrote a piece recently on how the ASX has become expensive at an index level but not in such a way that it warrants conversation about an equity market crash - you can check that piece out here:

3 topics
2 contributors mentioned

