TOL - 1st Feb, 2024
Stocks that "beat and miss": How they perform today and after the report
With data from the last 16 reporting seasons, we take a closer look at how companies have performed post-results.
Let's start with how the "beats and misses" fared during the August 2023 reporting season.
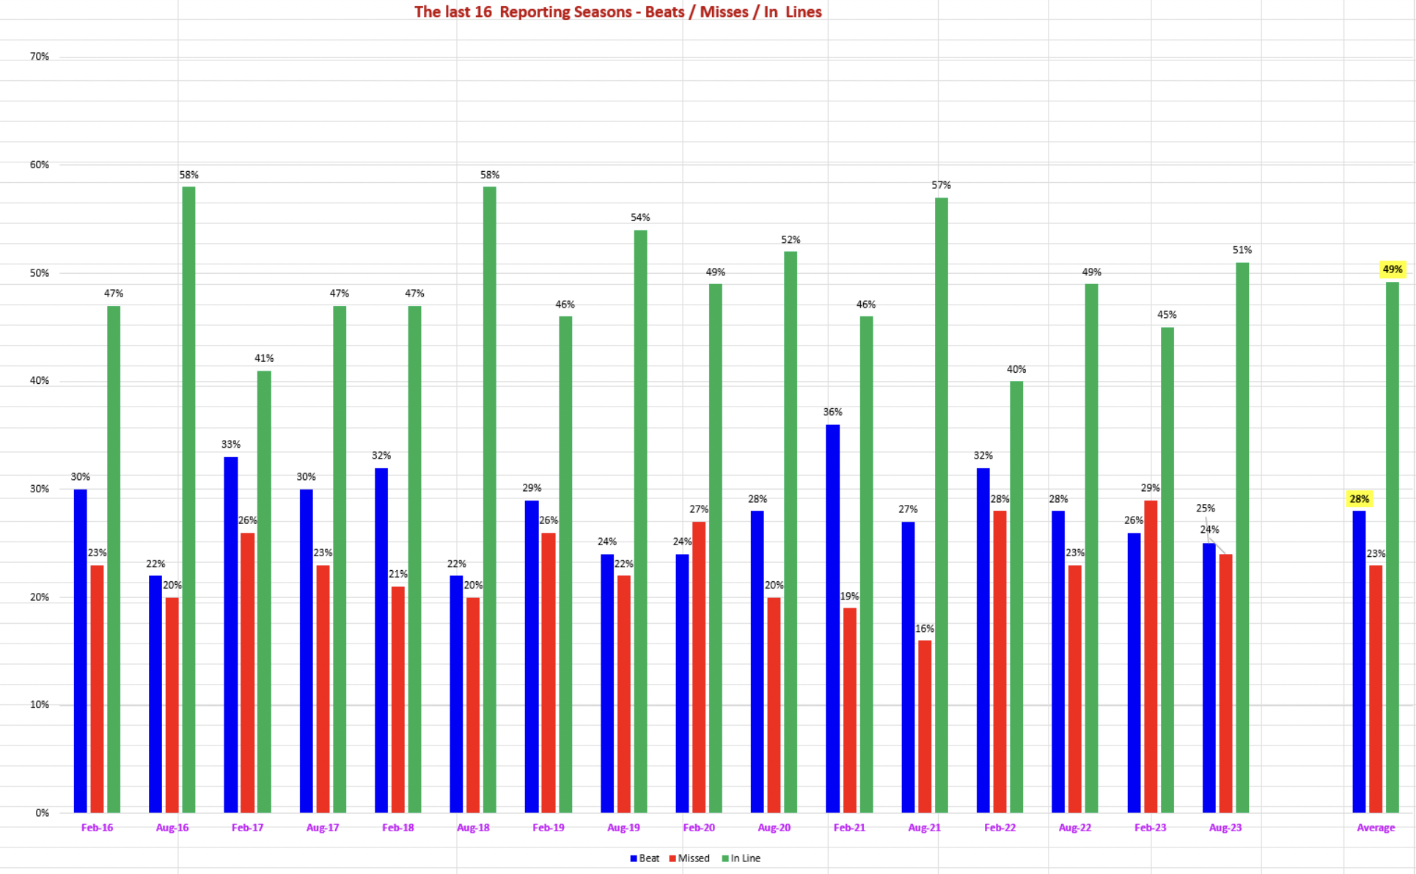
How they went last time - August 2023 - beats/misses/inline results

Beats were similar - this time at 25% vs Aug 2022 at 28%, and the Misses were at 24% vs 23% in Aug 2022.
Beats were a bit lower versus the average of the last 16 reporting seasons at 28% vs the 8-year average in August 2023 at 25%. The misses were 24% vs the 8-year average of 23%.
This table shows how each reporting season has gone in the last 8 years. The ASX 200 in Feb 2023 was down -2.92%, so the market was down that reporting season after being up for the previous five consecutive reporting seasons. Then again, during the last reporting season, in August 2023, the ASX 200 fell by 1.42%.
In the last 8 years, we have not seen three consecutive falls in ASX 200 in the reporting season. So maybe it will go up in February 2024?!
Interestingly of the last 16 reporting seasons, the market has been down 8 times (or 50% of the time).

During the last 16 reporting seasons, earnings beats have occurred approximately 28% of the time, misses happened around 23% of the time, while in-line results occurred half of the time.
How stocks moved on the day they reported – August 2023 reporting season
Did they follow the same pattern as the previous 15 reporting seasons?
- Beats: +6.8% (performed well)
- Misses: -7.3% (performed poorly)

The average moves in the last 16 reporting seasons
Beats have been up on average by +5.2% (vs 6.8% in August 2023) while Misses on average have been down -6.3% (vs -7.3% in August 2023). Humans tend to react more to bad news than good and thus treat them more aggressively. Meanwhile, in-line earnings in August 2023 saw share price increases of 0.3% (versus the long-term average of +0.1%). The average of all stocks reporting was an increase of 0.1% in Aug 2023.
Also of interest, in the last reporting season (August 2023), the "Beats" (as they do almost every time) had a “lower short interest” at 1.6% vs the Misses which are only slightly higher at 1.7% this time.
What happens over the next four months?

The Beats go on with it! As the chart below shows, the Beats are up +5.2% on the day they report and then over the next four months, companies that beat earnings go on to rise by another 6.7%. The outperformance by the Beats vs the ASX 200 has been strong - approximately 6.2% over the last 8 years (as can be seen clearly in a chart a bit further down).
As a group, the Beats have outperformed the ASX 200 four months later 87% of the time (that is, during 14 out of the last 16 reporting seasons).

Companies with earnings Beats, four months later
In the last 16 reporting seasons (blue bar) and then the purple bar shows where the ASX 200 was as a comparison.

The next chart shows how much the "Beats" have outperformed the ASX 200 (in fact, the outperformance has occurred every time - bar twice). In the four months after, the outperformance relative to the ASX 200 was an average of +6.2%.

The Misses
In the last 16 reporting seasons, the "misses" have closed down by an average of -6.3% on reporting day and then four months later, were still down by -8.4%. Also of interest, these stocks (misses) had the highest short interest (2.2% vs Beats at 1.7%), so it looked like the shorts were correct most times.
During the last reporting season (August 2023), the MISSES were down by an average of 7.3% on the day - and four months later, were down another -0.9%. In total, four months later, companies with earnings misses generally fall a total of -8.2% since reporting (versus the ASX 200, which was up +1.7% four months later).

Chart showing the last 16 reporting seasons - Day one move and then where they were four months later

Chart showing the earnings misses, 4 months later
In the last 16 reporting seasons, misses (yellow bar) and then the ASX 200 (iron red bar). The Misses were on average down -7.9% four months later. That is significantly underperforming the ASX 200, which was up +0.5% at the same time.

This chart says so much - the chart shows that Misses have underperformed the ASX 200 every time except once (August 2020 when the whole market rallied post-COVID). Four months later, the disparity is an average of -8.4%. During the last reporting season, they followed the same pattern yet again but the disparity was even worse at -9.9% vs the ASX 200's move.

Meanwhile, "In-Line" results increased +0.1% on the day and four months later, were down -0.34% - and thus under-performed the ASX 200 which rose +0.5% over the same period. The in-lines generally do ok - either up or down slightly.

This is a good indicator but you must instead look at something that has an excellent rate of success. After analysing 7.5 years and 15 actual reporting seasons, it’s far more important to look at what a stock does "on day one of reporting". That is because the market gets it right about 70% of the time via its day one reaction.
So you buy the stocks that are up on day one (or more importantly, don’t sell them after a big move to the upside (shorts will need to cover over the next few weeks). A "beat or "miss" may look like a good guide but more importantly, you sell the stocks that go down on day one - ASAP.
Get more insights from the insto desk in the Coppo report
This article is an excerpt from The Coppo Report contributed to Livewire by Richard Coppleson, Director - Institutional Sales and Trading, Bell Potter. You can find out more here.
You can also stay up to date with the latest news by hitting the ‘follow’ button and you’ll be notified every time I post a wire.
Never miss an update
Enjoy this wire? Hit the ‘like’ button to let us know.
Stay up to date with my current content by
following me below and you’ll be notified every time I post a wire
Richard authors “The Coppo Report”, a highly regarded market newsletter. He has over 30 years’ experience in financial markets, beginning his career at Ord Minnett where he worked for 15 years, before moving to Goldman Sachs.
........
Livewire gives readers access to information and educational content provided by financial services professionals and companies (“Livewire Contributors”). Livewire does not operate under an Australian financial services licence and relies on the exemption available under section 911A(2)(eb) of the Corporations Act 2001 (Cth) in respect of any advice given. Any advice on this site is general in nature and does not take into consideration your objectives, financial situation or needs. Before making a decision please consider these and any relevant Product Disclosure Statement. Livewire has commercial relationships with some Livewire Contributors.

2 topics
1 contributor mentioned

Richard authors “The Coppo Report”, a highly regarded market newsletter. He has over 30 years’ experience in financial markets, beginning his career at Ord Minnett where he worked for 15 years, before moving to Goldman Sachs.
Expertise
Richard authors “The Coppo Report”, a highly regarded market newsletter. He has over 30 years’ experience in financial markets, beginning his career at Ord Minnett where he worked for 15 years, before moving to Goldman Sachs.
Expertise
Comments
Comments
Sign In or Join Free to comment