The consensus is wrong: America’s economy is chronically ill
A “Remarkably Strong” Economy
The consensus is convinced: from the GFC to the COVID-19 pandemic the U.S. economy was robust, and since the pandemic it’s been remarkably strong. Although consumer confidence has underwhelmed, over the past several years expenditure and employment have exceeded many observers’ hopes, and disinflation (that is, the deceleration of the Consumer Price Index’s rate of increase) has occurred – albeit perhaps less quickly than expected.
“If the United States’ economy were an athlete,” crowed The Atlantic (“The U.S. Economy Reaches Superstar Status,” 10 June 2024), “right now it would be peak LeBron James. If it were a pop star, it would be peak Taylor Swift. Four years ago, the pandemic temporarily brought much of the world economy to a halt. Since then, America’s economic performance has left other countries in the dust and even broken some of its own records. The growth rate is high, the unemployment rate is at historic lows, household wealth is surging, and wages are rising faster than costs, especially for the working class. There are many ways to define a good economy. America is in tremendous shape according to just about any of them.”
The Atlantic elaborated: “let’s start with economists’ favourite metric: (the growth of Gross Domestic Product). When an economy is growing, more money is being spent. More stuff is being produced, more services are being performed, more businesses are being started, more workers are being hired – and, because of this abundance, living standards are probably rising …”
“Right now,” it concluded, “America’s economic growth rate is the envy of the world. From the end of 2019 to the end of 2023, U.S. GDP grew by 8.2% – nearly twice as fast as Canada’s, three times as fast as the European Union’s, and more than eight times as fast as the United Kingdom’s.”
The Federal Reserve’s Chairman, Jerome Powell, too, is celebrating. In a speech at its Dallas branch on 14 November 2024 he stated: “the recent performance of our economy has been remarkably good, by far the best of any major economy in the world. Economic output grew by more than 3% last year and is expanding at a stout 2.5% rate so far this year. Growth in consumer spending has remained strong, supported by increases in disposable income and solid household balance sheets. Business investment in equipment and intangibles has accelerated over the past year. In contrast, activity in the housing sector has been weak.”
The U.S. is the only G20 economy whose GDP now exceeds its pre-pandemic level. According to the most recent data (July-September 2024), its economy grew at an annualised rate of 2.8%, and its indefatigable consumers’ spending powered it.
Our Non-consensual Assessment
The consensus is demonstrably wrong: since the GFC the U.S. economy has been weak, and since the COVID-19 pandemic it’s been feeble. Its GDP has been rising – but its growth presupposes the federal government’s massive, debt-financed and eventually unsustainable budget deficits. Over the past year, expenditure exceeded revenue by $2 trillion; as a result, accumulated deficits presently total $36.6 trillion, and during 2024 skyrocketed at the astounding rate of $1 trillion every 100 days.
Without this massive “stimulus,” the U.S. would’ve been mired in recession since the GFC. Without Washington’s gigantic deficits, in other words, the U.S. economy can neither grow nor avoid an extended slump. The conclusion is therefore inescapable: like a man on a life-support machine, the health of America’s economy is woefully weak.
The implications are momentous. Rhetorically, the consensus has long acknowledged that at some point Congress must impose some semblance of control over the federal government’s runaway spending. “Oh Lord, give me chastity, but do not give it yet,” prayed the young Augustine of Hippo (354-430). So, in effect, have Congress and the consensus: few of its members believe that fiscal moderation – never mind retrenchment – must, should or even can come soon.
The eventual cost of America’s uncontrolled deficits and exponentially-rising national debt will be some kind of reckoning, perhaps in the form of a crisis which spreads to other countries. Laws of economics will ultimately reimpose what lawmakers have long refused to recognise.
America’s GDP Growth, Nominal and CPI-Adjusted, 1948-2024
Using quarterly data compiled by the Federal Reserve Bank of St Louis, Figure 1 plots nominal (that is, unadjusted for consumer price inflation) GDP’s rate of growth since January 1948. It plots short-term (rolling 12-month) as well as medium term (five-year) rates of growth. It expresses the latter as a geometric mean, i.e., as compound annual growth rate (CAGR).
The rolling four-quarter rates of growth have been comparatively more volatile (standard deviation of 3.6%) and the rolling 20-quarter rates less so (standard deviation of 2.2%). The medium-term rate of growth decelerated during the 1950s, accelerated during the 1960s and 1970s, and then commenced a long and mostly uninterrupted deceleration until the early 2010s. Since then it’s rebounded somewhat – to the level which prevailed just before the GFC.
Figure 1: Nominal Growth of GDP, U.S., January 1948-September 2024
The medium-term rate of growth accelerated during the 1960s and 1970s partly because consumer price inflation also quickened; similarly, growth slowed from the 1970s to the GFC because consumer price inflation also slackened. Figure 2, which plots GDP’s CPI-adjusted rates of growth since 1948, removes this distortion.
Figure 2: CPI-Adjusted Growth of GDP, U.S., January 1948-September 2024

The rolling four-quarter rates of CPI-adjusted growth remain comparatively more volatile (standard deviation of 3.0%) and the rolling 20-quarter rates less so (standard deviation of 1.3%). The medium-term rate of growth has fluctuated but mostly gently decelerated over the decades. It fell below 1% per year in 2009 and remained there until 2013. Since then it’s fluctuated between 1% and 2% – a far cry from the 5-6% which was common during the 1950s and 1960s.
Figure 3 plots CPI-adjusted rate of short-term and medium-term rates of growth over key intervals since 1948. The key result is that as time has passed the rate of growth has slowed. Whether over rolling 12-month or five-year periods, from 1948 to the eve of the GFC, GDP grew at an average rate of more than 3% per year. From 1948 to 2020 it grew less rapidly – at somewhat less than 3% per year. That’s because during the ten years to the eve of the COVID-19 pandemic it grew even more slowly – at an average of 2.3% per month (short-term) and 1.7% (medium-term).
Figure 3: CPI-Adjusted Average Growth of GDP, CAGRs, Various Periods 1948-2020
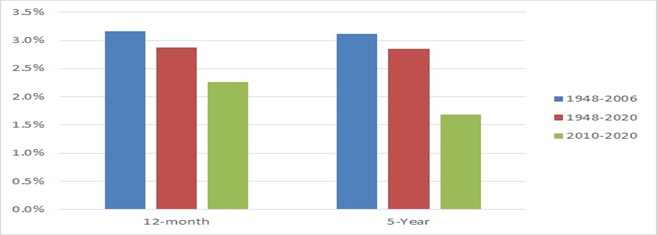
From 2010 to 2020, CPI-adjusted GDP’s medium-term CAGR was still lower – 1.7% per year. That’s roughly one-half its rate of growth from 1948 to 2006. As time has passed, in other words, the U.S. economy’s rate of growth has abated.
That’s not greatly surprising; nor is it necessarily a matter of particular concern. The world’s biggest economy can’t indefinitely grow more quickly than other economies – particularly developing ones. But this sanguine interpretation ignores at least one crucial development.
The U.S. Government’s Massive Budget Deficit
Figure 4 plots the U.S. Government’s deficit as a percentage of GDP. The deficit data are annual; via extrapolation, I’ve converted them into quarterly figures and matched them to the GDP data.
Figure 4: Budget Deficit as Percentage of GDP, Quarterly, January 1947-December 2023
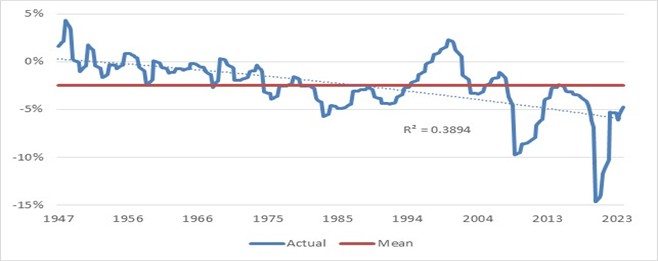
Since 1947, Washington’s deficit has averaged 2.5% of GDP. From then until the mid-1970s, it was well below this average (-0.5%); since the 1980s, it’s been above it (-3.7%). Over the past half-century, only during the Clinton era (January 1998-October 2001) has the U.S. Government’s revenues exceeded its outgoings.
During the GFC, the deficit skyrocketed to 10% of GDP. By 2015, however, it retreated to 2.5%. From then until the end of 2019, however – that is, mostly during Donald Trump’s first term – it rose to 6.8%. And during the COVID-19 pandemic it again zoomed to almost 15% during most of 2020 and 2021. Since then – that is, during the Biden administration – it’s recovered somewhat (to more than 5% and almost 6% in most of the quarters to 2023, and to 4.7% in the September-December quarter of 2023).
The latest-available quarterly number is noteworthy: at a time when the consensus exults that the America’s economy is remarkably healthy, Washington’s deficit is as large as a percentage of GDP as it was during the severe recessions of the early-1980s – and exceeds those during the recessions of the 1970s.
As the trend line indicates, particularly since the late-1990s the U.S. Government’s budget deficit has trended ever higher. To what percentage of GDP will it vault when the next recession or crisis occurs? Washington’s response to COVID-19 provides a strong hint.
Figure 5 plots one major consequence of the U.S. Government’s accelerating profligacy. In order to fight and win the Second World War, its accumulated deficits as a percentage of GDP (which the Great Depression had inflated to 52% in 1939) zoomed to 119% in 1946. From then until 1981, GDP grew more quickly than accumulated deficits; as a result, the national debt as a percentage of GDP collapsed to 31%.
Figure 5: Washington’s Accumulated Budget Deficits as Percentages of GDP, Annual, 1939-2023
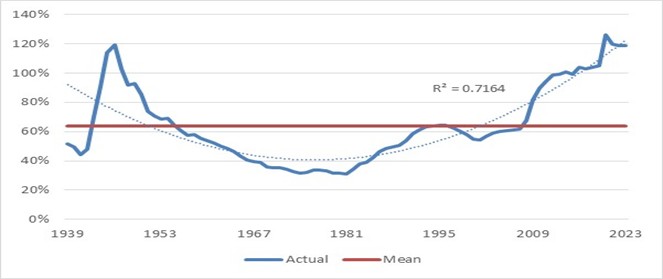
Since 1981, however, accumulated deficits have grown more rapidly than GDP. The ratio of debt to GDP skyrocketed during the GFC and COVID-19 pandemic; as a result, the national debt zoomed to 126%of GDP in 2020 – greater than in 1946. Since 2020 it’s receded modestly (to 119% in 2023).
Today, what has the U.S. to show for its record high debt-to-GDP ratio? In 1946, it could point to the defeat of Germany and Japan – and America’s rise to global economic, financial and military supremacy. Can it now say the same?
How high can America’s ratio of debt to GDP rise without provoking a reckoning? On the one hand, I wouldn’t be surprised if it continues to increase (Japan’s, after all, has long exceeded 200%). Equally clearly, another major consequence of the U.S. Government’s accelerating profligacy cannot rise indefinitely (Figure 6).
Figure 6: Interest Payments on Debt as Percentage of Federal Government’s Outlays, Annual, 1940-2024
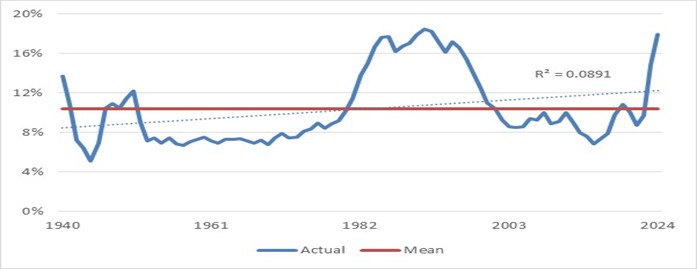
During the Second World War, the U.S. Government’s debt to GDP ratio zoomed – but because the Treasury and Federal Reserve connived to suppress rates of interest, payments of interest as a percentage of outlays plummeted from 14% in 1940 to just 4% in 1944. They subsequently rose above 10%, but remained below 8% until 1973. From 1983 to 1997 payments of interest consumed 15% or more of the budget. During and after this period rates of interest plummeted; as a result, by 2016 interest comprised just 7% of Washington’s outlays.
Since then, however, this percentage has risen rapidly; in 2024, payments of interest on the debt consumed $0.18 of each $1 of expenditure. That’s among the highest percentages on record.
Figure 7: U.S. Government Spending, FYTD 2025, Percentage of Total by Top Ten Categories
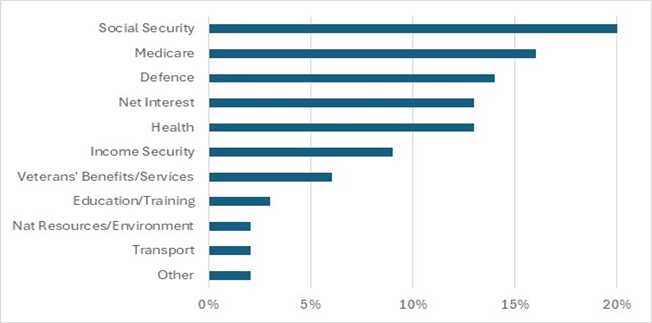
It’s also now among the U.S. Government’s biggest obligations. Using data from FiscalData, an agency of the U.S. Treasury, Figure 7 plots the top ten categories of the U.S. Government’s spending thus far in FY25. The fourth-largest category – almost as big as defence – is net interest on the debt. According to The Wall Street Journal (“The Era of Free Government Is Over,” 9 January), “interest repayments on federal debt ... are (now) higher than defence spending.”
(As a major holder of Treasury securities, the Federal Reserve, Social Security Administration, etc., are major recipients of interest payments on these securities, which it remits to the Treasury; FiscalData presents the U.S. Government’s payments of interest on a “net” basis).
My guess is that if this percentage rises to and remains above 20% – that is, when payments of net interest on the debt become the federal government’s largest category of expenditure – the likelihood of a backlash will rise.
Apart from the symbolism (the U.S. Government’s biggest obligation will be to its creditors rather than its people as a whole), at that point payments to America’s lenders will constrain disbursements to recipients of Social Security and Medicare, etc.
At that point, perhaps Americans will finally understand that Dick Cheney (who famously quipped “deficits don’t matter”) was dead wrong.
What If America’s Budget Deficit Disappeared?
What would have been the impact upon GDP’s rate of growth if since the Second World War the U.S. Government’s expenditures had never exceeded its revenue? The consensus, insists that deficits stimulate the economy – that is, boost GDP. Specifically, by placing money in their hands, deficits boost consumers’ and households’ expenditures; they also lift government consumption (salaries of bureaucrats, etc.).
The consensus ignores or even denies that deficits also “crowd out” investment.
For simplicity, and because today’s economic consensus is mostly Keynesian (that is, adheres, broadly speaking, to the ideas of the British economist John Maynard Keynes), I’ve adopted the Keynesian assumption that an increase of the budget deficit of $1 also increases GDP by $1, and that a decrease of the deficit of $1 decreases GDP by an equivalent amount.
I’ll thereby bypass a longstanding and complex debate on this subject. Keynesians generally assert that an increase of government expenditure (including deficit spending) of $1 increases GDP by $0.75 or more; a decrease of expenditure of $1, on the other hand, shrinks GDP by $0.75 or more. They’re therefore fiscal “doves” who advocate an increase of government spending, including debt-financed deficit spending, particularly in order to avert or combat recessions.
Anti-Keynesians, on the other hand, contend that an increase of government expenditure (including deficit spending) of $1 increases GDP by little or nothing – and that a reduction of $1 eventually begets additional private investment and consumption of $0.75 or more. They’re therefore fiscal “hawks” who (at least rhetorically, if not actually) advocate retrenchment, the reduction of government expenditure –Keynesians deride any deceleration of expenditure’s growth, never mind an outright decrease of spending, as “austerity” – and budget surpluses.
I’ve also (1) extrapolated the U.S. Government’s annual deficit into quarterly data; (2) subtracted this amount from each quarter’s GDP; (3) adjusted this deficit-adjusted GDP for CPI; and (4) excluded (given their enormous changes of GDP and deficits) the quarters since April 2020; Figure 8 plots the results.
Figure 8: CPI-Adjusted GDP Growth Assuming No Budget Deficit, 1948-2020

When deficits were comparatively modest (from 1948 until the GFC), the series in Figure 8 closely resemble their counterparts in Figure 2. Since then, however, when deficits have ballooned, the disparities are major. As a result, since the early-1980s GDP’s five-year CAGR has trended lower – and from October 2009 to April 2020 has averaged -1.7% per year (see also Figure 9).
Figure 9: Average CPI-Adjusted GDP Growth Assuming No Budget Deficit, CAGRs, 1948-2020
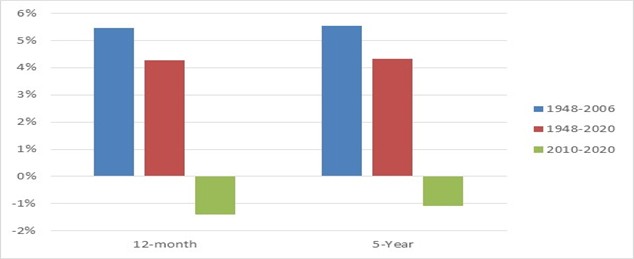
Without the “stimulus” of mostly growing deficits, since October 2009 the U.S. economy would have been mired in recession. Apart from its dependence upon the life support of deficit spending, America’s economy is strong!
Implications
At several points in its history, the U.S. has been seriously divided – culturally, politically and philosophically. Above all, it was most deeply and almost fatally rent in 1860, when South Carolina, followed by other Southern states, seceded. The War Between the States (1861-65) comprised two issues: slavery and federal control over tariffs (and economic development more generally). It killed ca. 600,000 and wounded another 1 million or more. That’s serious division!
In sharp contrast, fiscal policy since the since the Second World War – and particularly Washington’s continuously huge deficits since the GFC – reflects America’s essential unity. Indeed, in their determination to wreck the U.S. Government’s finances, Americans have seldom been more united than they are today.
Congress has enacted what the people have demanded: the federal government’s rising expenditure is effectively “untouchable.”
Even if Congress eliminated every penny of its “discretionary” spending, the federal government’s deficit would decrease but not disappear. That’s because “discretionary” spending comprises just 15% or so of total spending. Ultimately, addressing the deficit means some combination of (1) considerably higher taxes and (2) much lower spending (“non-discretionary” as well as “discretionary”).
Since the Clinton administration, Republicans have rejected option #1; all Democrats and most Republicans have vetoed option #2; therefore, all accept option #3 – a giant deficit.
Conclusion
A crucial inconvenient truth underpins America’s economy: it can grow – indeed, it can avoid recession – only if the federal government maintains its enormous, debt-fuelled deficits.
The federal government’s continuous and massive borrowing provides the economy’s life support. Yet debt can’t indefinitely grow more quickly than GDP; and the longer it does, the higher is the risk of fiscal crisis.
The Keynesian consensus is probably right about Washington’s runaway spending: Congress will “kick the can down the road” as long as possible. The U.S. is a democracy; its voters distrust governments but love most government spending; hence politicians supply what both people and politicians demand (see, for example, “Cutting the Deficit Is Easy – It’s Just Unpopular,” The Wall Street Journal, 26 December 2024).
How long can Congress and the American people defer tough decisions? Until interest on the federal government’s massive and rapidly growing debt, which is the consequence of decades of deficits, begins to constrain “non-discretionary” spending.
Until then, America’s economy, particularly as gauged by GDP’s CPI-adjusted rate of growth, will likely remain superficially robust. However, once payments of interest on the national debt (presently $36.6 trillion, it’s worth repeating, and increasing at the astounding rate of $1 trillion every 100 days) become the biggest component of federal expenditure, these payments will constrain “essential” spending – and pressure to reform it might grow.
Meanwhile, here’s another uncomfortable truth: Donald Trump, a populist, has erected his economic platform upon unpopular foundations. If he’s going to honour his promise to slash the deficit whilst cutting taxes, he’ll have to do some deeply unpalatable things – like cut military and “entitlement” spending.
If Keynesians are correct, then any shrinkage of the deficit will constrain America’s GDP – and even push its economy into long-term recession. If anti-Keynesians are right, then any sustained reduction of the deficit will initially crimp but ultimately spur genuine economic growth. Who will ultimately prevail?
Never mind Donald Trump’s Department of Government Efficiency (“DOGE”): given that he and the economic and financial consensus are largely Keynesian, expect the growth of the U.S. Government’s spending to continue, its huge deficits to persist, its mammoth debt to keep rising rapidly, its GDP to grow at an historically tepid pace – and, one day for all these reasons, a crisis to erupt.
Click LIKE so that Livewire knows that you want more of this type of content. Click FOLLOW for notification when my next wire appears.
5 topics

