The future of global energy markets
Being able to turn on a light is dependent on the stability of each link in what is a long, complex energy supply chain. An issue affecting any of these links can have an outsized impact on the energy system. In Part 1 of our examination of these risks we identified three independent risks that have combined to drive the spike in energy prices globally, and how identifying these risks revealed potential investment opportunities. In this Part 2, we will look to the present and future, whereas our energy systems have begun to decarbonise, new risks have emerged, including the potential loss of Australia’s cheap energy advantage.
Future risks
Australia’s global position in the decarbonised future stands in stark contrast to Australia’s privileged position in an industrialised, carbon-intensive global economy. While the changing relevance globally is clear, the changing nature of our risks should be considered.
In many ways, the path forward for Australia (and globally) appears clear: invest heavily in renewable energy generation, alongside the development of firming capacity (batteries, pumped hydro, hydrogen, and gas), in order to meet our net zero 2050 targets (albeit with the largest emitters in China, and third largest in India pushing, their own net-zero target dates to 2060 and 2070 respectively).
Yet again, underneath this accepted path lie significant (and sometimes similar) risks, discussed below in the context of our future path towards a decarbonised economy:
Future risk 1: constrained capital flows
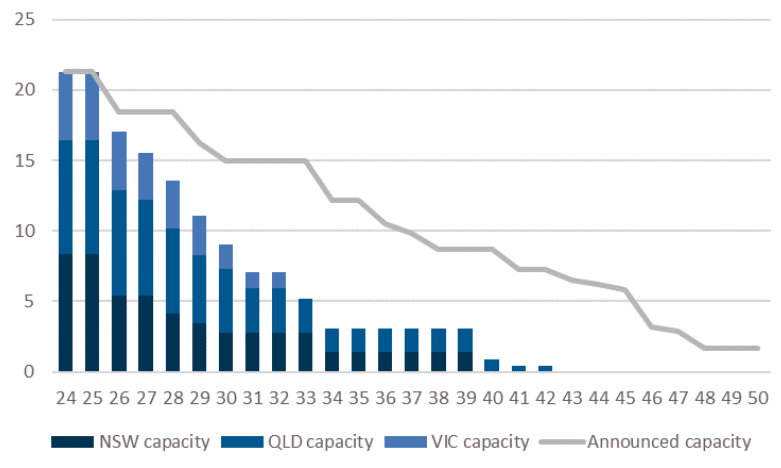
In some ways, this risk looks unlikely to change as we decarbonise. In the face of our coal fleet retirement, and the increasing likelihood of this path accelerating (Chart 1, below), the incentive to invest capital to maintain coal mines and coal-fired power stations is diminishing further. The risk here, then is seemingly clear: system reliability underpinning 75% of our electricity is declining. The increasing frequency of coal-fired generation outages seen over the past 12 months is indicative of this trend.
Chart 1: AEMO forecast coal capacity (step-change scenario) vs announced capacity (GW)

Data sources: AEMO. Calculations/charting: Merlon Capital. |
As governments become more nervous in the face of an accelerating retirement path, and rapid build out of renewable generation, we are potentially moving into the phase of knee-jerk reactions in order to regain a sense of control. As we have seen in the Federal government’s increasingly over-budget, over-time Snowy Hydro 2.0, NSW’s 2021-announced ‘Electricity Infrastructure Roadmap’ and the recently announced Victorian government’s decision to re-establish the State Electrical Commission, government at all levels is growing in size in Australia’s future electricity generation.
While such intervention may give a sense of greater certainty, the budgetary over-runs witnessed in the case of Snowy Hydro 2.0, coupled with the reduction in private investment that has occurred since intervention gathered pace under the previous federal government, ultimately crowds out (constrains) private, market-driven investment in renewable capacity (including critical investment in R&D of generation and firming technology), introduces the tax payer to cost over-runs, and risks reduced accountability as the political cycle continues.
Future risk 2: unbacked intermittent renewables growth
The acceleration in the retirement of stable coal-fired generation will expose us to the less-stable renewable generation. To date, the growth of intermittent renewable capacity has been largely backstopped by an oversupply of base-load and peaking generation. However, as the retirement of coal fired capacity continues (Chart 1), and renewable generation growth forms an increasingly large percentage of our energy mix, a technological solution to intermittency outside of base-load plants is becoming increasingly urgent (see constrained capital, above). The risk of not getting this right, is to face a 2021-like situation seen in the northern hemisphere.
Future risk 3.0: reliability of key suppliers
To meet the newly legislated 43% carbon emissions reduction target, Australia’s Energy and Climate Change Minister has noted the requirement to install 220,000 solar panels per day over the period leading up to the 2030 target.
Yet, and in a manner similar to that of Germany today and its supply of gas energy, Australia’s future renewable energy supply chain has already become highly reliant on a politically questionable supplier. China is currently the manufacturer of 80% of the world’s solar panel supply (IEA, July 2022).
Our exposure to this supplier will only grow as our coal retirement path rolls on (Chart 1, again), our generation fleet becomes more renewable, our car fleet becomes increasingly electric, and our housing stock replaces its gas supply with electricity, demanding significantly greater imports of photo-voltaic panels, electrolysers, wind turbines, lithium and other ‘critical minerals’ currently from China. Furthermore, we will be competing with the rest of the world to secure this supply, delivering even greater geopolitical leverage to China.
And, in turn, like Russia’s invasion of Ukraine, Australia’s (and the world’s) growing reliance on China for renewable energy generation and storage inputs may facilitate an escalation of tensions between China and Taiwan. In such a situation, and should Australia object in any way, it is not hard to see risks to this supply. We have already seen how China is readily willing to ‘punish’ Australia should it wish, as we have seen in 2021 with their banning of Australian coal. Energy has always been a geopolitical issue, and likely to increasingly be the case. And as such, we may witness more supply shocks contributing to energy disruption as well as inflation going forward.
Future risk 3.1: reliability of key suppliers
In the industrialised, carbon-intensive economic era post the 1850s, Australia has been ‘energy-advantaged’ with large volumes of cheap domestic gas supplies. In a similar way to Germany’s key supplier of cheap energy being Russia, we have been our own key supplier, and hence the reliability of this supply is still a critical question.
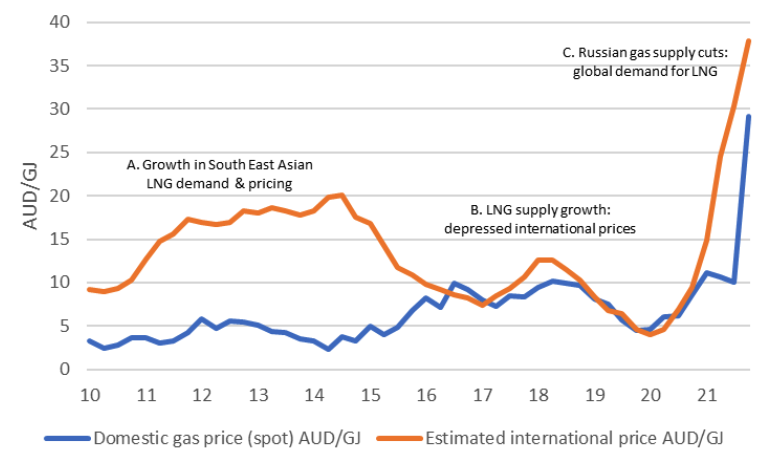
The chart below shows that before the commencement of large-scale (albeit higher cost) LNG exports from Australia’s east coast in 2015, Australia enjoyed significant energy competitiveness. From this point onwards, however, we can see how Australian spot gas prices have converged on international prices.
Chart 2: Australian domestic spot gas price vs international netback equivalent AUD/GJ

According to the ACCC, Australia could also be facing a shortage of domestic gas from 2023. Yet given the lack of investment in new capacity to service the lower priced (historically) domestic market, coupled with growing ESG-driven restrictions, Australia is now faced, like Germany, with the need to invest in a gas import infrastructure, beginning with import terminals in Geelong and potentially Port Kembla also. And with this new infrastructure comes the new direct link via imports to international market pricing.
Where to for Australian electricity prices
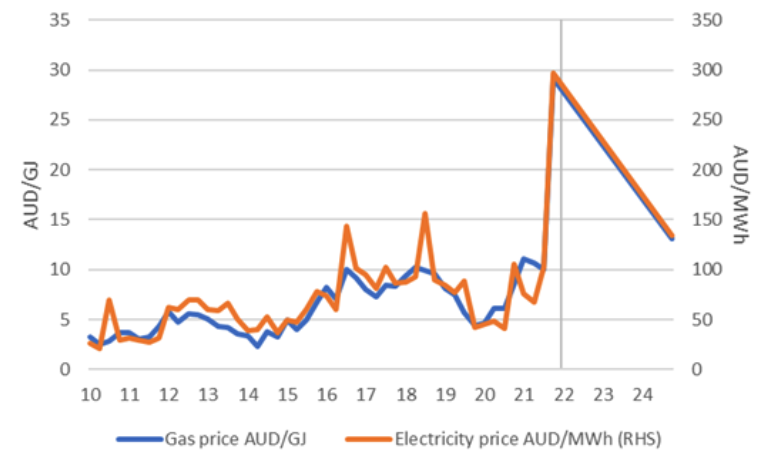
Given the key role of gas in electricity price formation (Chart 3), we are now able to model what could happen to our electricity price forecasts when we are exposed to international (rather than domestic) gas pricing. Using a relatively neutral international LNG price forecast of USD9.50/mmbtu (based on Brent oil futures of USD74/bbl), converting this into a domestic ‘netback’ gas price of AUD13/GJ, and then referencing the historical relationship between gas and electricity prices, we forecast a possible wholesale electricity price of AUD130/MWh.
In short this implies a ‘normal’ future electricity pricing environment 60% higher than the average over the period since 2010. It is important to note that this forecast is not based on today’s elevated spot international gas prices, but a return to a pre-COVID, pre-Russia / Ukraine ‘normal’ oil-linked contract environment (if such an environment is possible). Not only is this inflationary, but it also may signal the end of Australia’s era of energy advantage.
Chart 3: domestic gas prices vs electricity prices

Data sources: Australian Energy Regulator. Calculations/charting / forecasts: Merlon Capital. |
What does this mean for retail consumers? Applying our wholesale electricity price forecast of AUD130/MWh to the wholesale component of an ‘average residential customer’ electricity bill (as noted in the ACCC article: Cost of supplying electricity to households at an eight-year low, December 2021) implies an estimated 39% rise in retail bills from that point.
Who to blame?
Although the export of large volumes of ‘unconventional’ (read, costlier) gas via the Curtis Island LNG hub implies that we are exporting gas we need domestically, this more costly gas is only flowing due to the ability to export it at higher international prices (see point A. in Chart 3 above). Selling into the domestic market at the prevailing pricing regime would have rendered the investment loss-making, hence preventing this investment from occurring in the first place. It should also not be forgotten that there are already significant flows of gas from these projects into the domestic market, occurring outside of contract obligations.
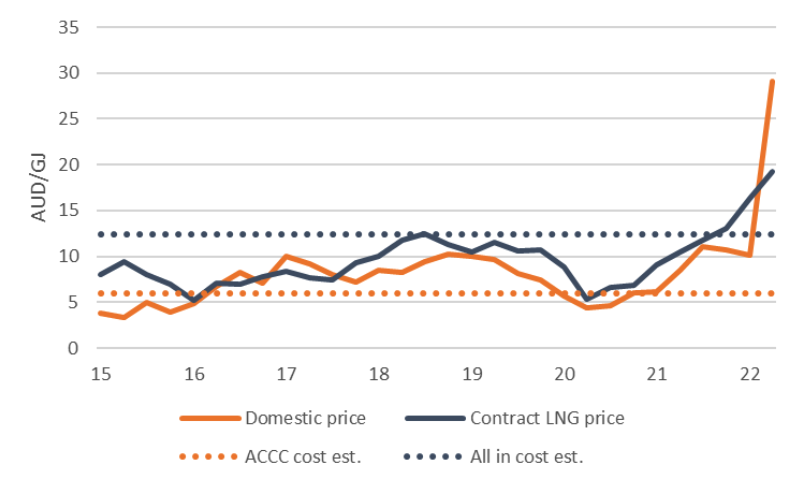
Chart 4 (below) shows the estimated, all-in cost that needs to be covered ‘through the cycle’ for the project to have been worth making. The ACCC operating cost line shown in Chart 11 – referenced widely in the media – is not wrong, yet it ignores other costs that should be considered, including the cost of the project’s original construction, the cost of financing this project, and the additional ‘return’ required to compensate for the risk of making the investment.
Chart 4: Gas price vs cost estimates

In other words, this gas would not have reached the ground had it not been for a higher-priced export opportunity, rendering these projects economic. As such, its existence now does not imply it necessarily should be made ‘available’ to any party, given the need for it to generate a return on the investment required to bring it to the ground. Forcing the re-routing of contracted export volumes into the domestic market at economically loss-making prices poses a sovereign risk for future large-scale investment in Australia. As a case in point, some currently large-scale LNG contracts are with the same parties seeking to source large-scale volumes of hydrogen from Australia in the future.
Conclusions
And this debate suffers as a result of its politicisation, in such ways as overstating the true, through-the-cycle profitability of these projects as noted above. The cost of this debate includes reduced focus on avoiding the future energy supply crunch, a reduced incentive for domestic and international parties to invest large-scale sums of capital into existing as well as new energy projects, and poor decisions made by governments reluctant to rely on markets and who feel it necessary to more directly control investment (as noted above), in a style more reminiscent to centrally planned economies, and all the associated inefficiency that this involves.
Never miss an insight
If you're not an existing Livewire subscriber you can sign up to get free access to investment ideas and strategies from Australia's leading investors.
And you can follow my profile to stay up to date with other wires as they're published – don't forget to give them a “like”.
3 topics

