TOL - 22nd Jun, 2024
The most consistent dividend paying stocks in the ASX top 50
Top 50 stocks and 1000 years of data. These are the most consistent dividend paying stocks on the ASX now, and (potentially) in the future.
Consistency is a trait valued in most endeavours, and it’s particularly valued in investing. Having a good idea of what to expect from your investments allows you to better plan for your financial future.
Many Aussie investors place great importance on dividend yield. Certainly, if you are looking for regular income – as many self-funded retirees are – dividends from Australian companies can offer excellent after-tax returns compared to other income-style investments like cash or term deposits.
In this article, I hope to show you the most consistent dividend payers on the ASX over the past 20 years. I’ve crunched massive amounts of data on the ASX’s Top 50 companies (so 1,000 years of data!) to hopefully bring you unique insights into which companies have rewarded investors with a steady income stream year-in-and-year-out.
I’ll also look at recent trends in dividend yields, as well as consensus forecasts, to try to determine which ASX companies are most likely to deliver strong dividend returns in the future.
Traps (and a few tips) for ASX dividend hunters
There are several potential traps in simply Googling information on the current dividend yields of Australian companies, then sorting this information by the yield column in a spreadsheet, and buying whatever happens to end up at the top.
The greatest risk in this method is most of the information freely available on the internet is based on historical information. What appears to be the top-yielding stock today might not deliver the same yield next year.
Investors should always remember there are two pieces to the dividend yield equation: price and dividends. Price is at the bottom of the dividend yield equation, and so a low price could potentially flag a high dividend yield – but it could also flag a stock in serious financial difficulty.
It’s possible that a seemingly high dividend yield is a result of investors heavily selling down a company’s shares on the basis its earnings (and therefore dividends) are expected to be significantly lower in the future.
In this scenario, the dividend yield actually received by an investor is likely to be substantially lower than what was received in the past. This is commonly referred to as a “yield trap”.
What is a grossed-up dividend yield and why is it so important?
Another potential trap for Aussie investors is not considering “grossed-up” yield. Australian companies can choose to pay franked dividends that have an attached credit for the tax the company has paid on the profits from which the dividend was derived.
A “fully franked” dividend from the ASX’s most consistent dividend payers typically affords a 30% tax credit (reflecting the company tax rate of 30 cents in the dollar). In this way, fully franked dividends are tax-paid income.
Many Aussie investors are on marginal rates of tax lower than 30 cents in the dollar, and so for these investors, franking credits can dramatically increase the attractiveness of dividend earnings.
To put this into perspective, for a taxpayer on an average marginal tax rate of 30 cents in the dollar, a $1 dividend requires no further tax payment. Compare this to a $1 interest payment on a term deposit which would typically require the investor to pay 30 cents in tax. This taxpayer would end up with the full $1 after-tax from their dividend, but only 70 cents after-tax from their interest.
It gets even better for taxpayers on lower marginal tax rates. For example, a taxpayer on a 0% marginal tax rate, that same $1 dividend is worth as much as $1.42 (e.g. for certain superannuation income streams – ask your financial adviser about these, not us!).
Not all companies pay fully franked dividends. Some of them pay “partially franked” dividends (i.e., less than 30 cents in the dollar tax has been paid by the company), or “unfranked dividends” (i.e., dividends have been paid from untaxed company profits).
So, it’s clear that when we’re comparing the most consistent dividend yields on the ASX, we should do so on a grossed-up yield basis, that is, including any franking credits associated with a dividend.
What is a consistent dividend yield anyway?
For some, when it comes to stock returns, consistency might simply mean a high rate of return. I suggest achieving a higher return that also delivers very high volatility is hardly “consistent”. For me, consistency means a low variation in return – for whatever degree of return you’re chasing.
Of course, the magnitude of return is important, but the challenge is to find the best return for the least volatility. It’s not just me trying to do this, it’s the first rule of investing!
So, how do we measure the volatility in dividends from a company? Well, we could simply measure the standard deviation of the dividend yield for a company over the sample period (in this article it’s 20 years). To do this you’d have to know a stock’s price each time it paid a dividend, because using today’s stock price to find the yield of a dividend paid in 2006 is meaningless.
In the Top 10 data tables below, I have done exactly this – I’ve referenced the each ex-dividend date and associated it with the corresponding prior session’s closing price for each stock to get a better picture of how their dividend yield has changed over time.
For example, here’s how the yield of Commonwealth Bank of Australia (ASX: CBA) has changed over the last 20 years. (I’ll do a few more of these when we get to the top dividend yield tables later!)

On first pass, measuring the standard deviation in a company’s dividend yield to check its consistency seems appropriate, but I propose it’s actually quite faulty.
Firstly, upside volatility in a company’s dividend yield is welcome – it’s what we call “beneficial volatility”. The basic standard deviation calculation takes into account both upside and downside volatility, so it will penalise stocks that have demonstrated strong dividend yield growth.
We just want to see the variance in the downside volatility, but this is also problematic when analysing dividends. I found that several companies over the last 20 years paid “special dividends”. These are ad-hoc extra dividends companies pay to return excess capital and or franking credits to shareholders.
A special dividend could bump up a stock’s dividend yield in one year, only for it to return to a more normal level the next. This variance would show up as downside dividend yield volatility – and we don’t want that.
In the end, I chose not to adjust for special dividends / calculate downside volatility because who’s to say the capital from a special dividend could not have been drip-fed into future dividends, thus increasing future dividend yields?
Instead, to get a better idea of consistency in a stock’s dividend yield, I chose to compare each stock’s average grossed-up (GU) yield with its lowest grossed-up yield experienced in the sample period. This is perhaps the best alternative to measuring downside volatility given it represents the maximum downside in grossed-up yield during the period.
The most consistent ASX dividend-paying stocks
That’s the methodology – let’s get down to the results! I have prepared for you a range of tables and charts aimed at informing you which ASX stocks have had, and are likely to continue to have the best and most consistent dividend yields.

The first table is more about performance, but to be fair – we are looking at an average grossed-up yield, and an average in itself implies a degree of consistency over a particular look-back period. These are the top 20 highest-yielding ASX stocks in the sample list based on average grossed-up dividend yield.
The best performer is probably no surprise to many of you – iron ore miner Fortescue (ASX: FMG). It has enjoyed buoyant iron ore prices over the last several years and this has led to bumper profits and dividends for shareholders.
FMG’s average 11.0% grossed-up yield over the last 13 years, whilst impressive, is less than half of that paid at the peak of 25.1% in 2018 – so there’s considerable downside volatility in the lookback period, and this is typical of cyclical commodity stocks.
In terms of downside volatility, it might concern you that FMG’s minimum grossed-up yield is just 1.8%. Personally, I’d look past this as it occurred very early in FMG’s lookback period. Perhaps more useful, is the 8.7% minimum grossed-up yield over just the last 8 years – a period where FMG’s average grossed-up yield is a whopping 15.4%!
In the next few spots on the table, we have the who’s who of ASX blue chip royalty in Wesfarmers (ASX: WES), Telstra Group (ASX: TLS), Suncorp Group (ASX: SUN), all Big 4 banks, and BHP Group (ASX: BHP). Yields bottom out in the Top 20 at 5.3%, which I suggest is a very solid average grossed-up yield over the last 20 years.
Averages can look past the outlying bad bits, though. For example, Insurance Australia Group (ASX: IAG), ASX (ASX: ASX), and Scentre Group (ASX: SCG) each sport solid average grossed-up yields, but each has a significantly lower minimum grossed-up yield. Worse again – each stock touched its respective low point in grossed-up yield within the last few years.
The final point to note here is we haven’t considered capital gains or losses over the period. The price of Telstra, for example, is lower today than it was 20 years ago. So, when considering consistency, we really should be working on a total return basis.
(Perhaps I will explore the most consistent ASX dividend stocks that have delivered the best capital returns plus dividends in a future article!)

The table above shows the stocks with the most boring (and bulletproof!) dividend yields over the last 20 years. But note, none of the four table toppers have actually been around for 20 years – so we should consider if there’s enough of a track record for each to go on.
I suggest Medibank Private’s (ASX: MPL) 9-year stint of metronomic dividends is enough for it to deserve the top spot, and its 6.0% average grossed-up yield over that period is also very attractive.
Coles Group (ASX: COL), Amcor (ASX: AMC), Stockland (ASX: SGP), Macquarie Group (ASX: MQG), and Mirvac Group (ASX: MGR), round out the list of stocks that have delivered greater than 5% average grossed-up yield with very little downside deviation.

Each of the lists in this article are designed to help you make an educated decision as to which dividend stocks you might wish to add to your portfolio. This one is here to remind you about the oldest saying in financial markets: Past performance is no indicator of future performance!
There’s no guarantee the best and most consistent dividend payers over the last 20 years will be the same over the next 20. Unfortunately, I can’t provide you data on grossed-up dividend yields for the next 20 years (I wish!), but I do have access to broker consensus data for the next 12 months. So it will have to do!
FMG retains the top spot here with a very juicy 12.7% 12-month forward grossed-up yield, and it’s joined by Westpac (ASX: WBC) on 9.0%, Woodside Energy (ASX: WDS) on 8.5%, GPT Group (ASX: GPT) on 8.0%, and Rio Tinto (ASX: RIO) on 7.8%. All excellent yields compared to current cash and term deposit rates, and potentially within the context of sourcing passive income.
Dividend Yield Charts of consistent ASX dividend stocks
I find these charts are really helpful in visualising each company’s performance and consistency over the relevant lookback period.
Perhaps the most important aspect, though, is being able to see the recent trend in dividend yield for each company. In my experience, the trend really is your friend, so you may wish to prioritise stocks demonstrating uptrends in their dividend yield.
I’ll leave you with a few charts of the main consistent dividend payers discussed in this article, as well as a couple that I found to have nice grossed-up yield uptrends (e.g. ANZ Group (ASX: ANZ), APA Group (ASX: APA), and Origin Energy (ASX: ORG)).
Finally, you’ll find right at the end of the article a Master List that contains all the data from my investigation. Enjoy!


%20Grossed%20Up%20Dividend%20Yield.png)


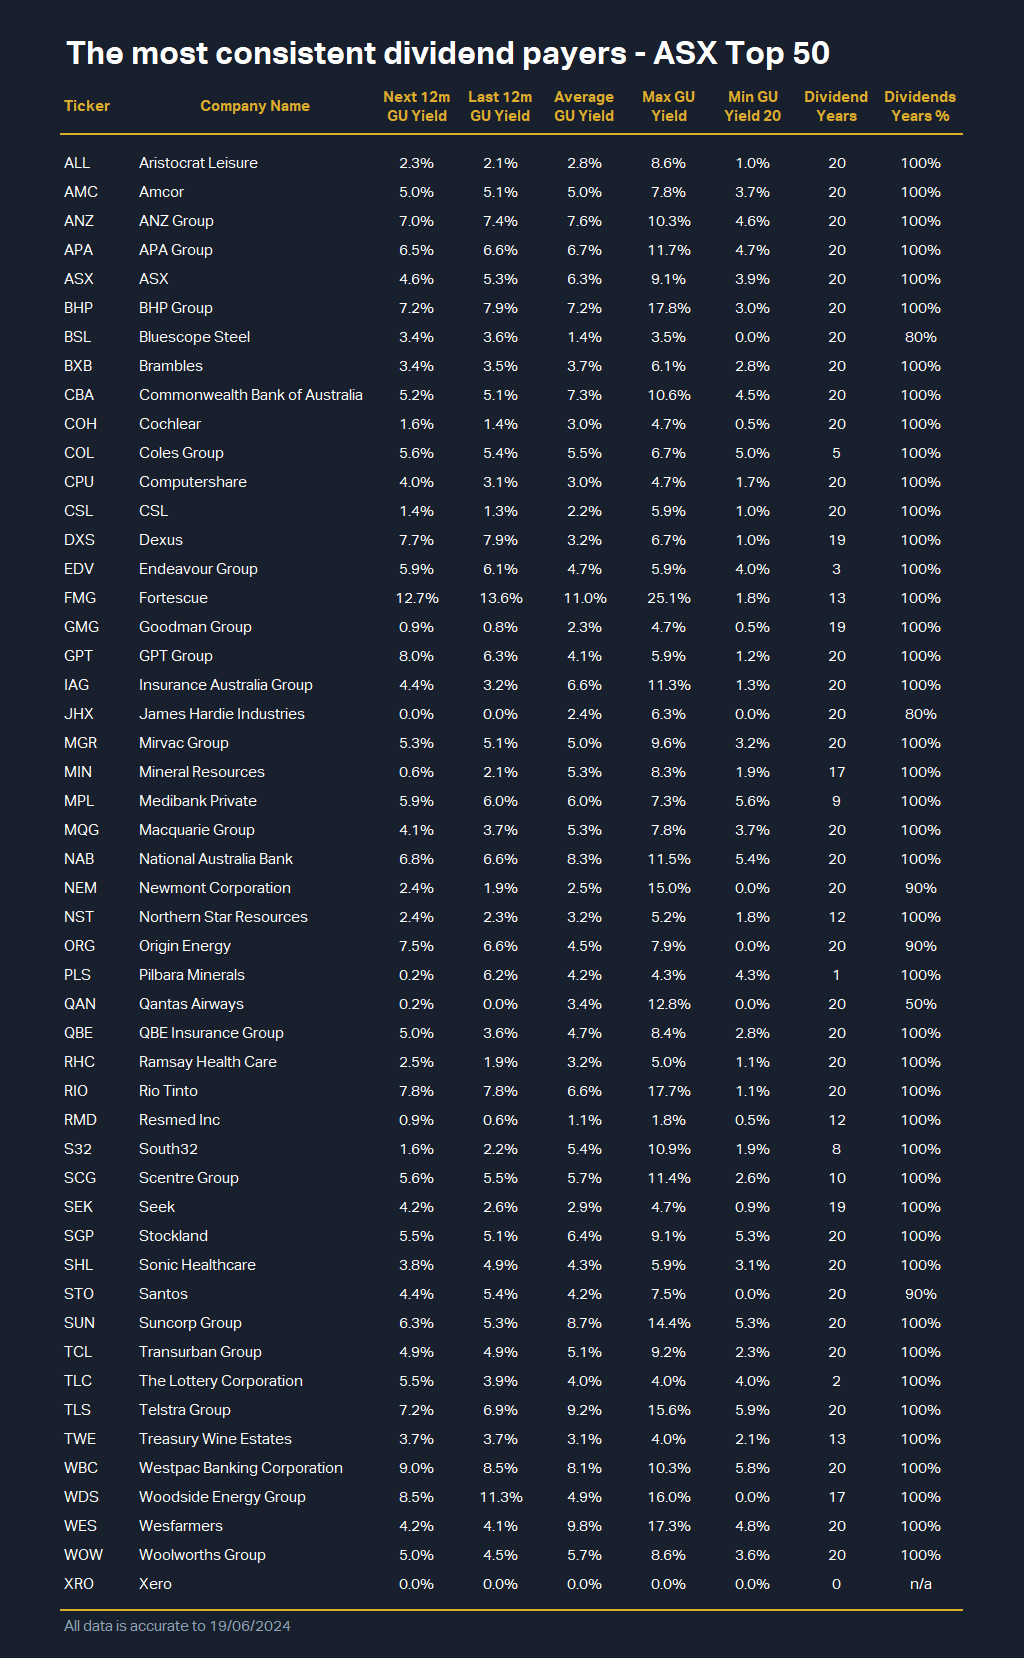
For the full size image of this table: Click here.
Table 4: Master List: The most consistent dividend payers - ASX Top 50. “Dividend Years” is how many years the company has been a dividend payer (max 20 given 20-year lookback period). For example, MPL began paying dividends 9 years ago, whereas BHP paid dividends in every year of the 20-year lookback period. “Dividend Years %” is the ratio of years a company paid a dividend compared to Dividend Years. For example, MPL paid a dividend in all of its Dividend Years, whereas QAN only paid dividends in half of its Dividend Years.
Never miss an update
Enjoy this wire? Hit the ‘like’ button to let us know.
Stay up to date with my current content by
following me below and you’ll be notified every time I post a wire
Carl has over 30-years investing experience and has helped investors navigate several bull and bear markets over this time. He is a well respected markets commentator who specialises in how the global macro impacts Australian and US equities. Carl has a passion for technical analysis and has taught his unique brand of price-action trend following to thousands of Aussie investors.
........
Investing is risky. Inevitably you will endure losses. If you can't cope with losing, don't invest.

5 topics

Carl has over 30-years investing experience and has helped investors navigate several bull and bear markets over this time. He is a well respected markets commentator who specialises in how the global macro impacts Australian and US equities. Carl...
Carl has over 30-years investing experience and has helped investors navigate several bull and bear markets over this time. He is a well respected markets commentator who specialises in how the global macro impacts Australian and US equities. Carl...
Comments
Comments
Sign In or Join Free to comment