The tides are turning: Rising interest and tax rates – implications for Private Equity returns
In a particularly interesting but concerning note distributed by the Federal Reserve for investors, Michael Smolyansky[1] persuasively argues that:
"The reduction in interest and tax expense is responsible for a full one third of all profit growth for S&P 500 nonfinancial firms over the prior two-decade period."
With interest rates clearly climbing and with corporate tax increases being passed by Congress (for example President Biden’s 15% minimum corporate tax rate legislation), the author’s contention is that it is very likely corporate profit growth will decline resulting in lower stock returns in the future.
In this article, we consider what rising interest and tax expenses might mean for private equity (i.e. buyout) returns.
In summary, the key points of Smolyansky’s excellent article are:
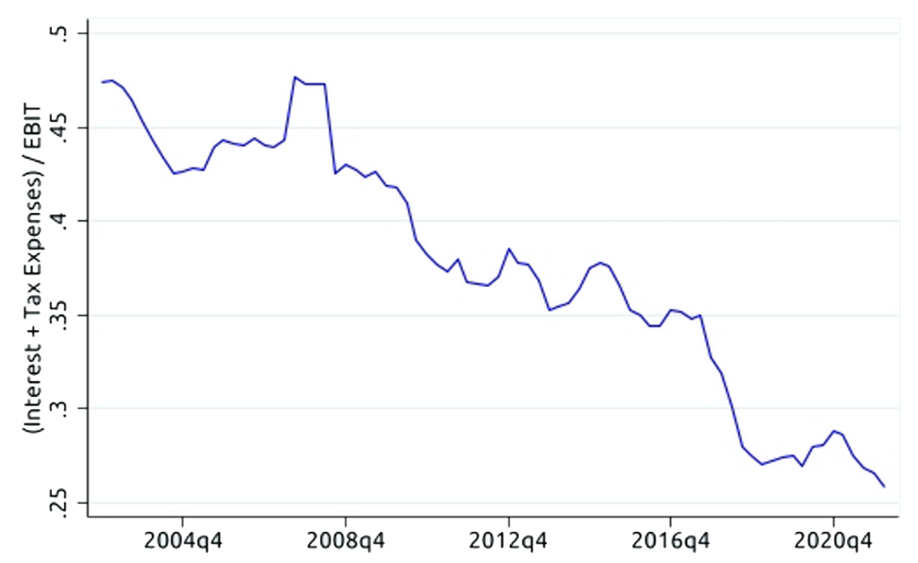
1. Interest and tax expenses have steadily declined relative to earnings for S&P 500 non-financial firms. Prior to the Global Financial Crisis (GFC), the ratio of interest and tax expenses to earnings before interest and taxes was just over 45%. In the first quarter of 2022, this ratio had fallen to 26%, meaning more of the corporate earnings are made available to shareholders.

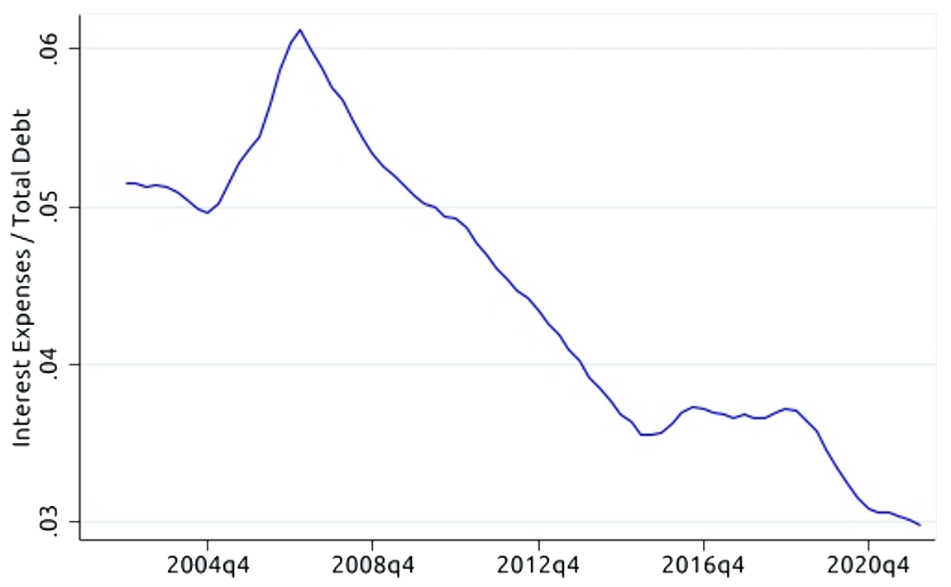
2. The key driver of the decline in interest expense was the decline in corporate interest rates, which largely mirrored the decades-long decline in Treasury yields. In 2007, just prior to the GFC, interest rates faced by S&P 500 non-financial firms were just north of 6% but by the end of 2019, prior to the COVID pandemic, interest rates had declined to 3.5%, falling to 3% by the first quarter 2022. Not only did interest rates decline, but leverage rose.

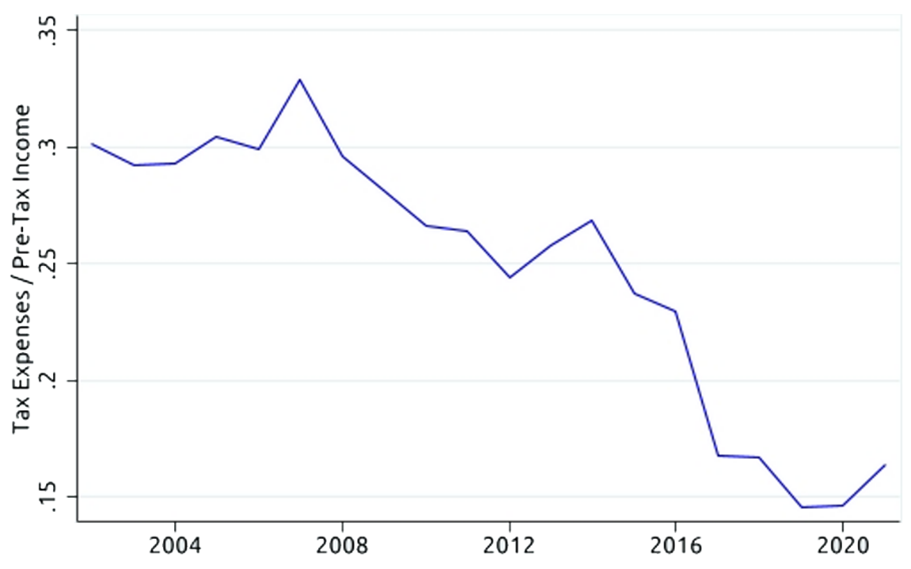
3. Tax expenses declined from 30% of corporate earnings in 2004 to 15% in 2020, with the most significant cut in taxes attributable to the Tax Cuts and Jobs Act of 2017 which cut the statutory tax rate from 35% to 21%.

4. The reduction in interest and tax expense alone is responsible for approximately one third of profit growth. Net income grew at 5.4% p.a. in real terms over the last 20 years but would have grown at 3.6% p.a. if not for the decline in interest and tax expenses.
5. It is very likely the reduction in interest and tax expense contributed to a stimulative boost to overall economic activity and revenue growth. Therefore, it is very likely an increase in interest rates and a likely increase in tax expenses will lead to a reduction in overall revenue growth which could have an even greater impact on stock market returns.
The reduction in interest and tax expense alone is responsible for approximately one third of profit growth
What does this mean for buyout returns?
Buyouts are typically more highly leveraged so it follows that an increase in interest rates is likely to have an even greater impact on the returns from buyout investments. An increase in tax rates is also likely to have a negative impact but probably lower than for large listed corporations given the higher tax shield afforded by higher interest expense. In any case, we consider below, the impact that higher tax expense and higher interest rates might have on buyout returns.
Buyouts and the Impact of Higher Tax and Interest Expense
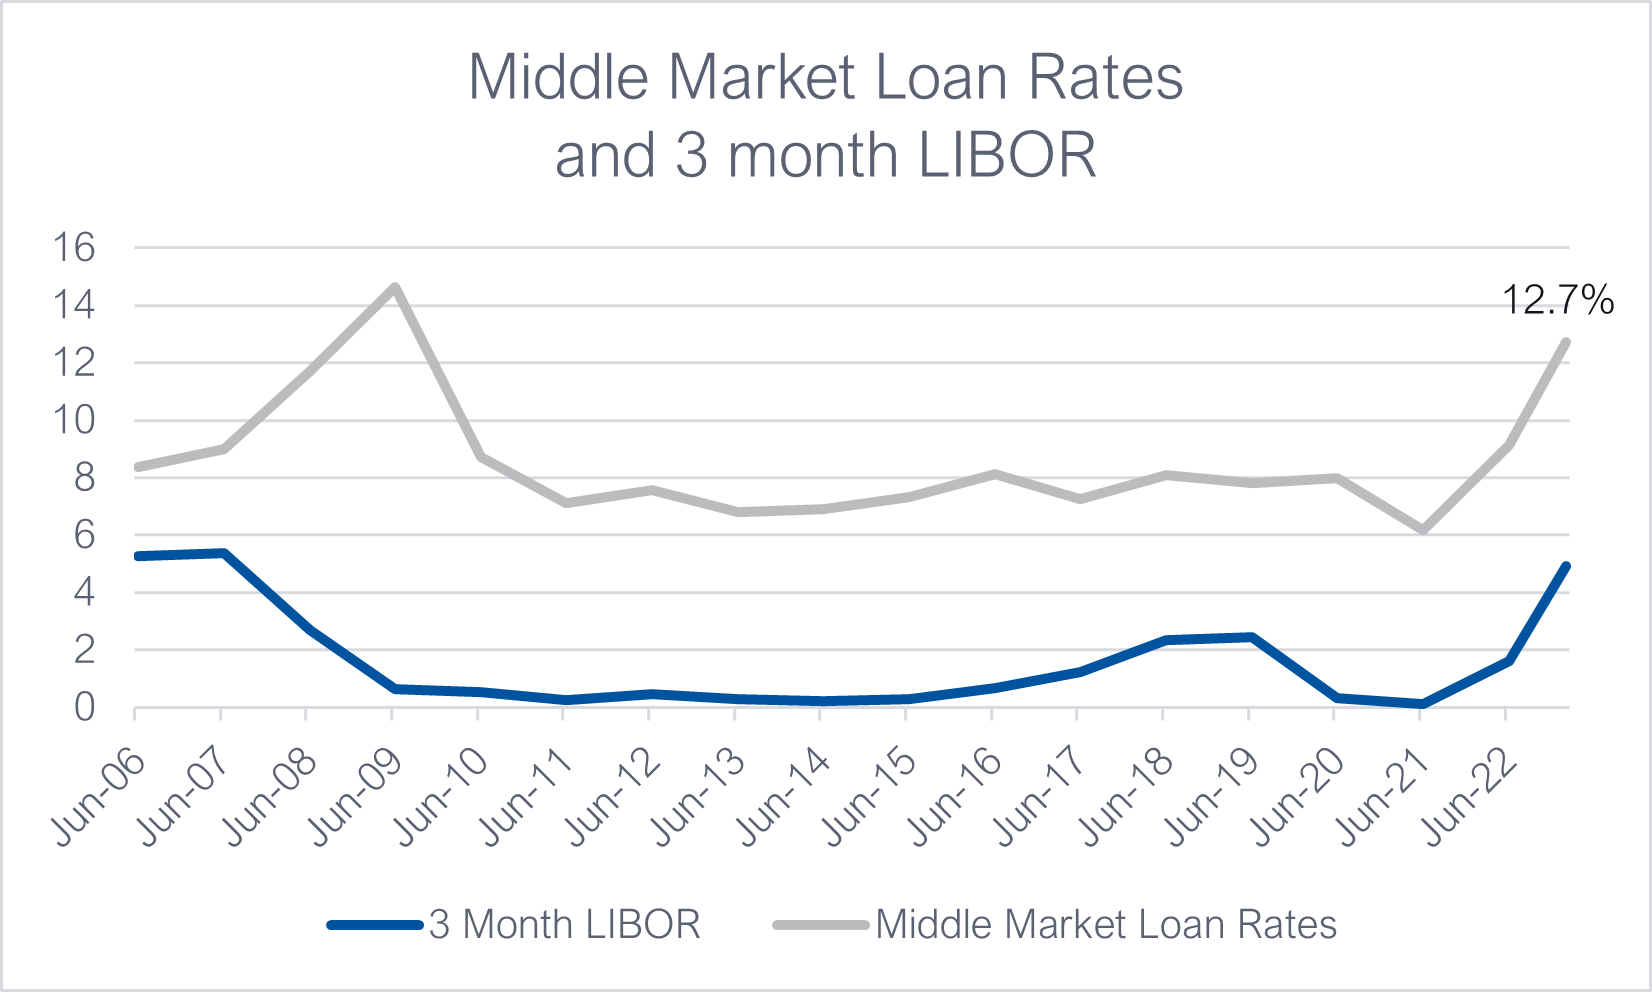
Middle market buyouts are typically financed by loans provided by a private credit manager or, increasingly less so these days, a regional bank. Typically, the loans provided to fund a mid-market buyout are 5- to-7year floating rate term loans benchmarked to the London Interbank Offered Rate (LIBOR), although this is increasingly moving towards the Secured Overnight Financing Rate (SOFR). The graph below shows the historical rates for LIBOR and middle market loan credit spreads:

Source: Credit Spreads - PennantPark Q3 2022 Investor Presentation. LIBOR Rates – Macro Trends Data
The all-in cost of middle market loans to fund a private equity transaction have almost doubled since 2013
Interestingly, the all-in cost of middle market loans hasn’t varied as much as for large corporate loans, but the rates have still moved significantly, backing up from 6.8% in 2013 to over 12% today (and rising).
The data table below shows the change in Internal Rate of Return (IRR) and Multiple of Invested Capital (MOICs) for different tax and interest rates when input into our financial model of buyout returns (see Appendix 1 for LBO Model Assumptions which drive these returns):
MOIC
The table above shows that our LBO model transaction generates a 2x MOIC when borrowing costs are 6% and tax expenses 15%. If everything else remains the same but interest rates increase to 10% and tax expenses to 30%, the MOIC drops to 1.7x. In IRR terms (see table below), the return would drop from 15.1% to 11.7%.
IRRs
What this exercise fails to capture, is that increasing interest rates generally coincide with two things:
- slowing economic activity
- declining deal multiples.
Deal multiples – that is, multiple expansion – has been a particularly key driver of private equity investment returns over the past 20 years and this is the subject our next research piece – Interest Rates and Deal Multiples – A Major Source of Value Creation May Be Over.
In regards to earnings growth, the table below shows the impact on deal MOICs of different levels of interest rates and EBITDA growth. It shows that investment returns are more sensitive to changes in operating conditions and EBITDA growth than interest rates. The table also highlights the tipping point at which deals begin to fail and this more than anything can determine portfolio outcomes.
The table above shows that once interest rates start to creep above 6% and EBITDA growth falls by more than 5%, deals begin to lose money (this assumes no change in deal entry and exit multiples). Once interest rates climb above 6% and EBITDA falls by 15% p.a., the result is a wipe-out. All invested capital is lost.
Deal Failure and Capital Loss Experience – A Key Driver of Portfolio Returns
A typical private equity fund comprises 10 to 12 deals. Of which there will inevitably be winners and losers. In venture capital portfolios, the “unicorns”, deals that attain valuations over $1 billion that earn many multiples of the capital invested, can easily make up for deals that lose money. In fact, many venture capital managers expect up to one third of deals to lose 100% of capital, one third of deals to return capital only, and one third of deals to earn multiples of original capital invested, with these deals driving the overall return for the fund.
For buyouts, the returns are, not surprisingly, more tightly bound than for venture funds. In our experience of over 17 years of investing in buyout funds, whether a buyout fund is a top quartile performer or a bottom quartile performer, the fund can pivot on the one or two deals that might fail.
To illustrate this point, take a portfolio comprised of eight deals that all return 15% p.a. over a five-year hold period. This portfolio will return a gross IRR of 15% p.a. and a MOIC of 2x. If just one of these deals fails (returning a 0x MOIC), the portfolio return will drop to 1.76x and 12% IRR. If two deals fail, it drops to 1.5x MOIC and 9% p.a. IRR.
If, as very likely anticipated, higher interest rates and higher tax rates are accompanied by tougher operating conditions, then the expected IRRs for the sector could fall. Using the above example, if the IRRs on the deal that didn’t fail dropped to 12%, then in the scenario that one deal fails, the portfolio IRR would drop to 9% p.a. and the MOIC to 1.54x; if two deals fail, the portfolio MOIC drops to 1.32x and an IRR of 4%, a level which is clearly unacceptable.
With many of the tailwinds that have driven both strong private equity and public equity returns possibly slowing or even reversing, we believe it is sensible to manage portfolios with an eye to limiting the potential for capital losses. This is more easily said than done, of course, but some of the obvious strategies include:
- investing with managers that employ less financial leverage;
- investing with managers that have clear sector expertise and a focus on operational performance enhancement;
- investing with managers that have a proven track record of managing companies through economic downturns.
Another key consideration is to invest with managers that have the capital available to support companies financially through turbulent times. In fact, there is a lot of evidence to show that the outperformance of private equity over public equities is due to the lower capital loss experience of private equity-backed companies through periods like the GFC.
The Advantage of Financial Sponsor Backing
The slowing, or even reversal, of some of the strong tailwinds that have driven strong public equity returns and even stronger private equity returns is likely to negatively impact returns going forward. Overall, though, we believe private equity is likely to fare better than public equities in tougher market conditions, one of the key reasons being the lower rate of capital loss or deal failure for private equity-backed (i.e. financial sponsor-backed) companies.
Our experience of managing private equity portfolios through the GFC and more recent Covid crisis has been that private equity-backed companies fare comparatively better. Companies backed by a financial sponsor are less vulnerable to fickle public equity and debt markets and are generally in a stronger position to negotiate with banks, for example, by providing some “top up” equity to negotiate relief from debt covenants or dilutive equity raisings.
One research paper[2] analysed a dataset of more than 3,200 companies acquired between 2000 and 2009 and held through the GFC from 2008 to 2009 found that private equity-backed businesses defaulted at less than one half of the rate of comparable listed companies (2.84% versus 6.17%). This is at odds with the general perception of private equity being higher leveraged, higher risk. The evidence is to the contrary.
Private equity is likely to fare better than public equities in tougher market conditions
Summary
The decline over the last 20 years of interest and tax expenses has increased deal returns meaningfully. A deal that might have returned 2x in the lower tax, lower interest rate environment might now only return 1.8x in the higher tax, higher rate environment. But what is likely to have had an even larger impact on portfolio returns is the relatively low rate of corporate failure through the low interest rate and low tax environment, coinciding with the positive economic growth environment. What will happen going forward? We don’t know but it would seem sensible to take a more conservative approach and to invest with managers that use less financial leverage and that are equipped to manage companies through tougher conditions. Whatever the case, private equity is likely to continue to outperform public equities, in part because of the advantage of financial sponsor backing.
Appendix 1- LBO Model Assumptions
The key assumptions underpinning the LBO model used in the analysis above are:
[2] Private Equity Council Paper. The Credit Performance of Private Equity-Backed Companies in the “Great Recession” of 2008 to 2009
[1] Smolyansky, Michael (2022). The Coming Slowdown in Corporate Profit Growth and Stock Returns”, FEDS Notes. Washington: Board of Governors of the Federal Reserve System, September 6 2022.
2 topics

