Update on bank liquidity requirements...
While our updated numbers imply the banks need to buy about $408bn of government bonds for liquidity purposes over the next few years, it is interesting to see how little the market and the banks themselves have focussed on their regulatory liquidity requirements over the near-to-medium term (rather than just the immediate term). There are a couple of good reasons for this.
First, investors tend to not be focussed on regulatory liquidity because it is complex and boring, and were, for example, universally surprised by APRA’s decision to close the $136 billion Committed Liquidity Facility (CLF), with material consequences for both credit (and bank bonds in particular) and government bonds (and State government bonds, or semis, more specifically).
Shutting the CLF forces banks to issue more debt to replace this facility with cash on deposit at the RBA or government bonds (both are classified as Level 1 "high quality liquid assets" or HQLA1). Government bonds encompasses both Commonwealth and State government bonds, although banks strongly prefer the latter because they pay much higher yields.
Investors seem not to have expected the 30-35 basis points (bps) move wider in bank-issued senior bond spreads despite us repeatedly writing about this risk and forecasting the rapid decline of the CLF (see also here).
For the banks, managing short-term funding and liquidity is the paramount priority. It is not widely understood---even within banks (albeit outside of the bank treasury teams)---just how volatile the banks’ liquidity metrics are. One key metric, called the Liquidity Coverage Ratio (LCR), measures the share of HQLA (ie, government bonds and cash on deposit at the RBA) that banks hold relative to a 30-day stress-test of their expected Net Cash Outflows (known as NCOs) in a simulated liquidity shock.
It is not unusual for a bank’s LCR to move by 20-30 percentage points in a single day. The regulatory minimum LCR is 100%. So banks have to hold HQLA sufficient to cover 30 days of NCOs. But because of the inherent volatility of LCRs, banks prudently hold a 25%-50% buffer above this 100% regulatory minimum to insure against the risk of sudden changes in their LCRs. This is why most bank boards target minimum LCRs of 125% to 135%.
Banks do not forecast changes in their LCRs beyond 3-6 months simply because of the complexity and challenge of managing LCRs in the short-term. And bank funding strategies are likewise very focussed on the next 3, 6 and 12 months.
This means that banks can lose sight of medium term funding and liquidity changes. One noteworthy example is the need to repay the RBA the $188bn the banking system borrowed under the Term Funding Facility (TFF).
It is very clear that the banking system has not really turned its mind properly to what happens after they repay this money over 2022, 2023 and 2024. When the RBA established the TFF, it created digital cash in the form of deposits that banks hold at the RBA in what is known as their Exchange Settlement Accounts (ESAs).
So the $188bn TFF resulted in the RBA giving the banks $188bn of ESA cash. As the TFF is repaid, this ESA cash will disappear. Importantly, all this ESA cash is currently counted in the banks’ LCRs as HQLA. And not many banks are running LCRs way above their internal targets. Repaying the TFF will therefore disappear an enormous amount of HQLA (ESA cash) that the banks will have to replace with more HQLA (ie, government bonds).
Our credit analysts have spent an enormous amount of time modelling the banking system’s HQLA shortfall as a result of several variables:
- The closure of the $136bn CLF in 2022, which disappears $136bn of assets that counted in the banks’ LCRs as a substitute for HQLA;
- The repayment of the $188bn TFF, which disappears $188bn of ESA cash and hence $188bn of HQLA;
- Growth in deposits, which generally create new NCOs, and require banks to hold more HQLA against those deposits; and
- Changes in NCOs themselves (eg, if banks try to manage NCOs).
We update these models each time banks report their financial results and their Pillar 3 numbers. We also update the models when APRA releases new banking statistics.
Following the release of the latest APRA banking data last week and all the banks’ results/Pillar 3 reports, we have revised our estimates of the amount of HQLA the banking system will need to fund and buy over the next three calendar years.
What we discovered in the September quarter was that the banks had no idea the CLF closure was coming, even though APRA had written to them on multiple occasions and warned for them to prepare for a world in which the CLF would be zeroed in the “foreseeable future”.
Instead, we saw banks selling government bonds, or HQLA, in the September quarter to the tune of $20.4 billion. At the same time, NCOs increased in the September quarter by 4.1%, driving yet more HQLA demand.
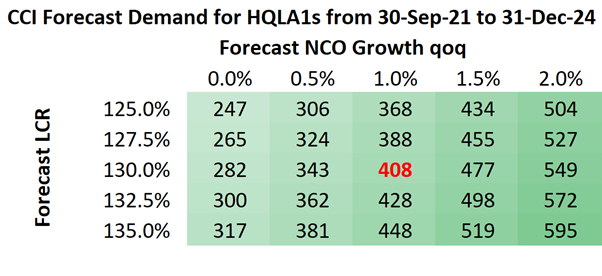
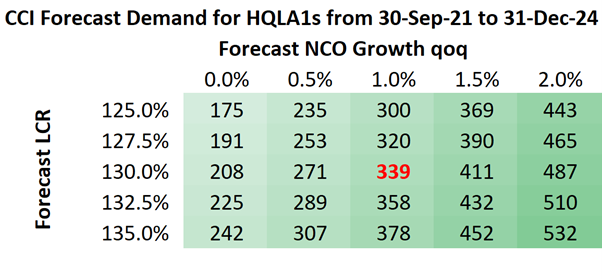
Accounting for these changes, we updated our HQLA buying forecasts. The first table below shows the new numbers while the second shows the prior results. As you can see, our base case has gone from a previous estimate of $339bn of HQLA buying to $408bn of HQLA buying over the next 3 calendar years due to lower-than-expected current HQLA coupled with higher-than-expected NCOs. That bond buying is the equivalent to four different RBA QE programs (assuming $100bn each).
While NCOs normally track deposit growth, banks might try to reduce NCO growth through deposit repricing strategies, although this will cost them in both net interest margins and return on equity. And no banks really appear to believe they can fully control their NCOs (some think they can influence them at the margin).
Furthermore, APRA is making the NCO calculations tougher for banks given how rubbery some of the NCO numbers have been in the past, with APRA slapping both Macquarie and Westpac with penalties for dodgy liquidity calculations in recent times.


Even if we assume in the most optimistic case that banks can somehow engineer zero NCO growth for three years running (ie, de facto reduce NCOs notwithstanding that the banks' balance-sheets will be expanding), and that they are also able to run lower system-wide LCRs of 125% (vs the current 130% average), they still need to fund and buy $247 billion of HQLA over the next 3 years. That is equivalent to 2.5x standard RBA QE programs (of $100bn each).
There is one important difference, however, when the banks buy government bonds. When the RBA buys government bonds, it splits its purchases 80/20 in favour of Commonwealth vs State government bonds. Yet when the banks buy government bonds, the split them 70/30 in favour of State securities (or semis). This is because these assets pay a positive spread above the swap rate whereas Commonwealth government bonds do not.
Two things may further help the banks with their bond buying. For banks that hold their government bonds in a mark-to-market portfolio, the capital they retain against these assets is determined using a Value-at-Risk (VaR) model using 2 years’ worth of prior rolling data. The shock that was March 2020 should drop out of this VaR model in February next year (as two years passes), reducing the capital they have to hold against government bonds. This could be a very material change.
For those banks that have hold-to-maturity (or accrual rather than mark-to-market) portfolios for their liquid assets, which is most banks, they now have a new VaR shock in the form of the sudden spike in interest rates in October and November 2021. We know this because we run these VaR models ourselves. This new VaR shock, which for banks that were long duration was actually worse than the March 2020 shock, results in a much more favourable capital treatment for State government bonds. This is because in October/November 2021 the spread on State government bonds over the swap rate actually compressed, making banks money, whereas in March 2020 this spread above the swap rate jumped some 30-40bps.
The hold-to-maturity VaR models using 6 years of rolling data (rather than the 2 years used by the mark-to-market portfolios). Importantly, the VaR models only select one shock: so as you shift from the March 2020 shock to the October/November 2021 shock, the capital you have to hold against different types of assets can theoretically shift materially.
Put another way, the March 2020 shock resulted in banks having to hold much more capital against State government bonds because of the spike in their spreads relative to the swap rate. The move out of this shock into a new shock where State government bonds outperform could quite easily reverse this unfavourable capital treatment out.
Of course, this depends on the assets the bank chooses to hold in its liquids portfolio. Different asset mixes could result in a different shock being selected by the VaR model. Equally, though, the bank can then optimise its asset holdings to minimise its capital and maximise its return on equity given a set of capital assumptions.
4 topics

