US stocks have soared this year. Here's why the music is about to stop
If you ever needed confirmation that the real economy is not the same as the stock market, today's reality provides that confirmation.
On the economic side, the prophets of doom have painted a dark picture indeed. Inflation is high and remains sticky, rates are high and will likely remain so, mass layoffs have begun, and company defaults have begun.
But hang on. The NASDAQ 100, with its long-duration assets that should be feeling the heat of high financing costs, is up almost 40% this year.
NVidia (NASDAQ: NVDA), this year's best performer, has returned 196% this year. That's right, it's basically tripled in value. And we're only at July.
In this wire, I'll take a stab at partly explaining why the stock market has rallied when everything else is in the hurt locker. And why the good times are about to stop.
Quantitative Tightening (sort of)
For monetarists, liquidity is the fuel that really dictates markets. More of it means more investment and happier share prices.
The Federal Reserve is one of the key drivers of that liquidity.
Through the monetary policy experiment of the past decade, the Fed's balance sheet reached an astronomical US$9 trillion in size.
The Federal Reserve has two main ways it can throttle down the economy. First, by raising rates, and second, by pulling liquidity from the market by selling its assets back onto the private markets.
Let's look at the second part of that.
As the below chart shows, the Fed has slowly been reducing its balance sheet, albeit with a very large about-face in March due to a spike in loans made to struggling regional banks via the Bank Term Funding program. Total assets now sit at about US$8.3 trillion.

In the round, this paints a picture of shrinking liquidity.
But this might not be the best rendering of Fed liquidity at all.
Fed net liquidity
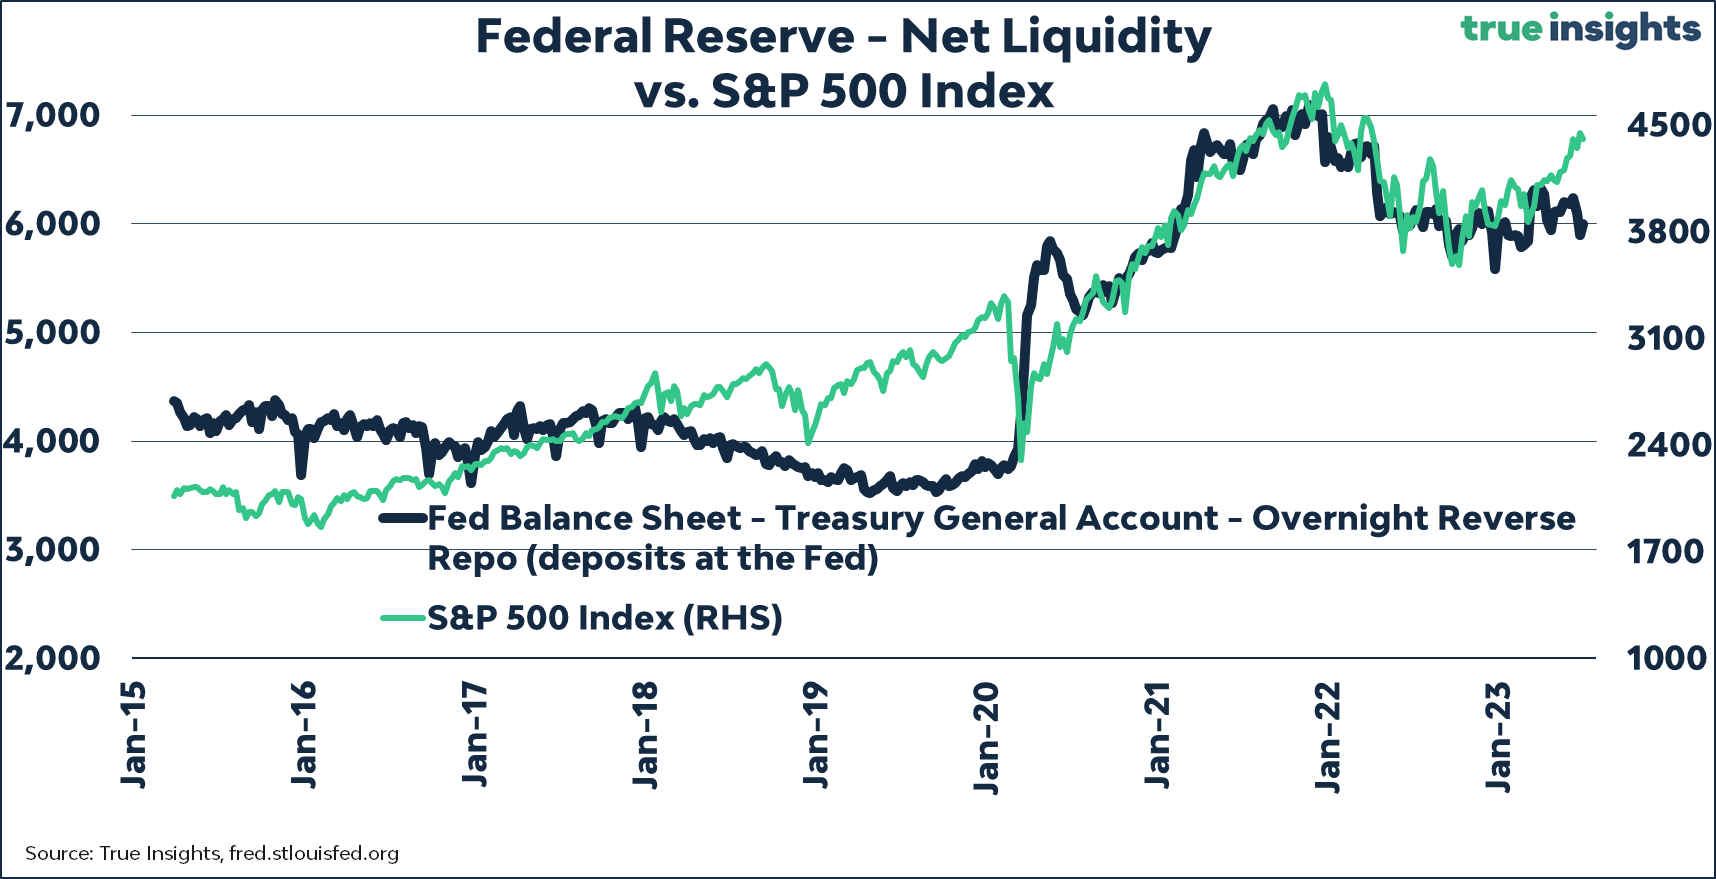
Many commentators point to "Fed net liquidity" as a more appropriate measure for calculating the fair value of the S&P 500. It's arguably a better reflection than the asset base of the liquidity-producing components of the Federal Reserve.
Where the formula came from is debatable (not that it really matters). Max Anderson, Darius Dale, and Crossborder Capital all lay claim to it. One of them's telling the truth.
In any case, the formula is:
Net Liquidity = Fed Balance Sheet - (Treasury General Account + Reverse Repo)
In other words, the Fed balance sheet minus both the amount of money shifted into Treasury and the short-term loans made in the reverse repo market.

As the chart above shows, since early 2020 the S&P500 has shown a strong correlation to increases in liquidity.
Why discount pre-2020 I hear you ask?
According to Anderson, "In past cycles, [the] size of Fed's balance sheet changed a lot, while TGA and RRP changed relatively little. So the size of the balance sheet roughly equated to Net Liquidity."
"[But] starting in 2020, relative changes in TGA and RRP have been three times larger than the change in the size of the Fed's balance sheet. As a result, changes in TGA and RRP have taken over as the primary drivers of Net Liquidity."
Recently, those two lines have diverged. Fed net liquidity is trending down, while the market continues trending up. If you subscribe to monetarism, that's very bad news for stocks in the back half of 2023.
Another bad sign
Not a monetarist? I've got you covered too.
Let's look at another leading indicator - bond yields.

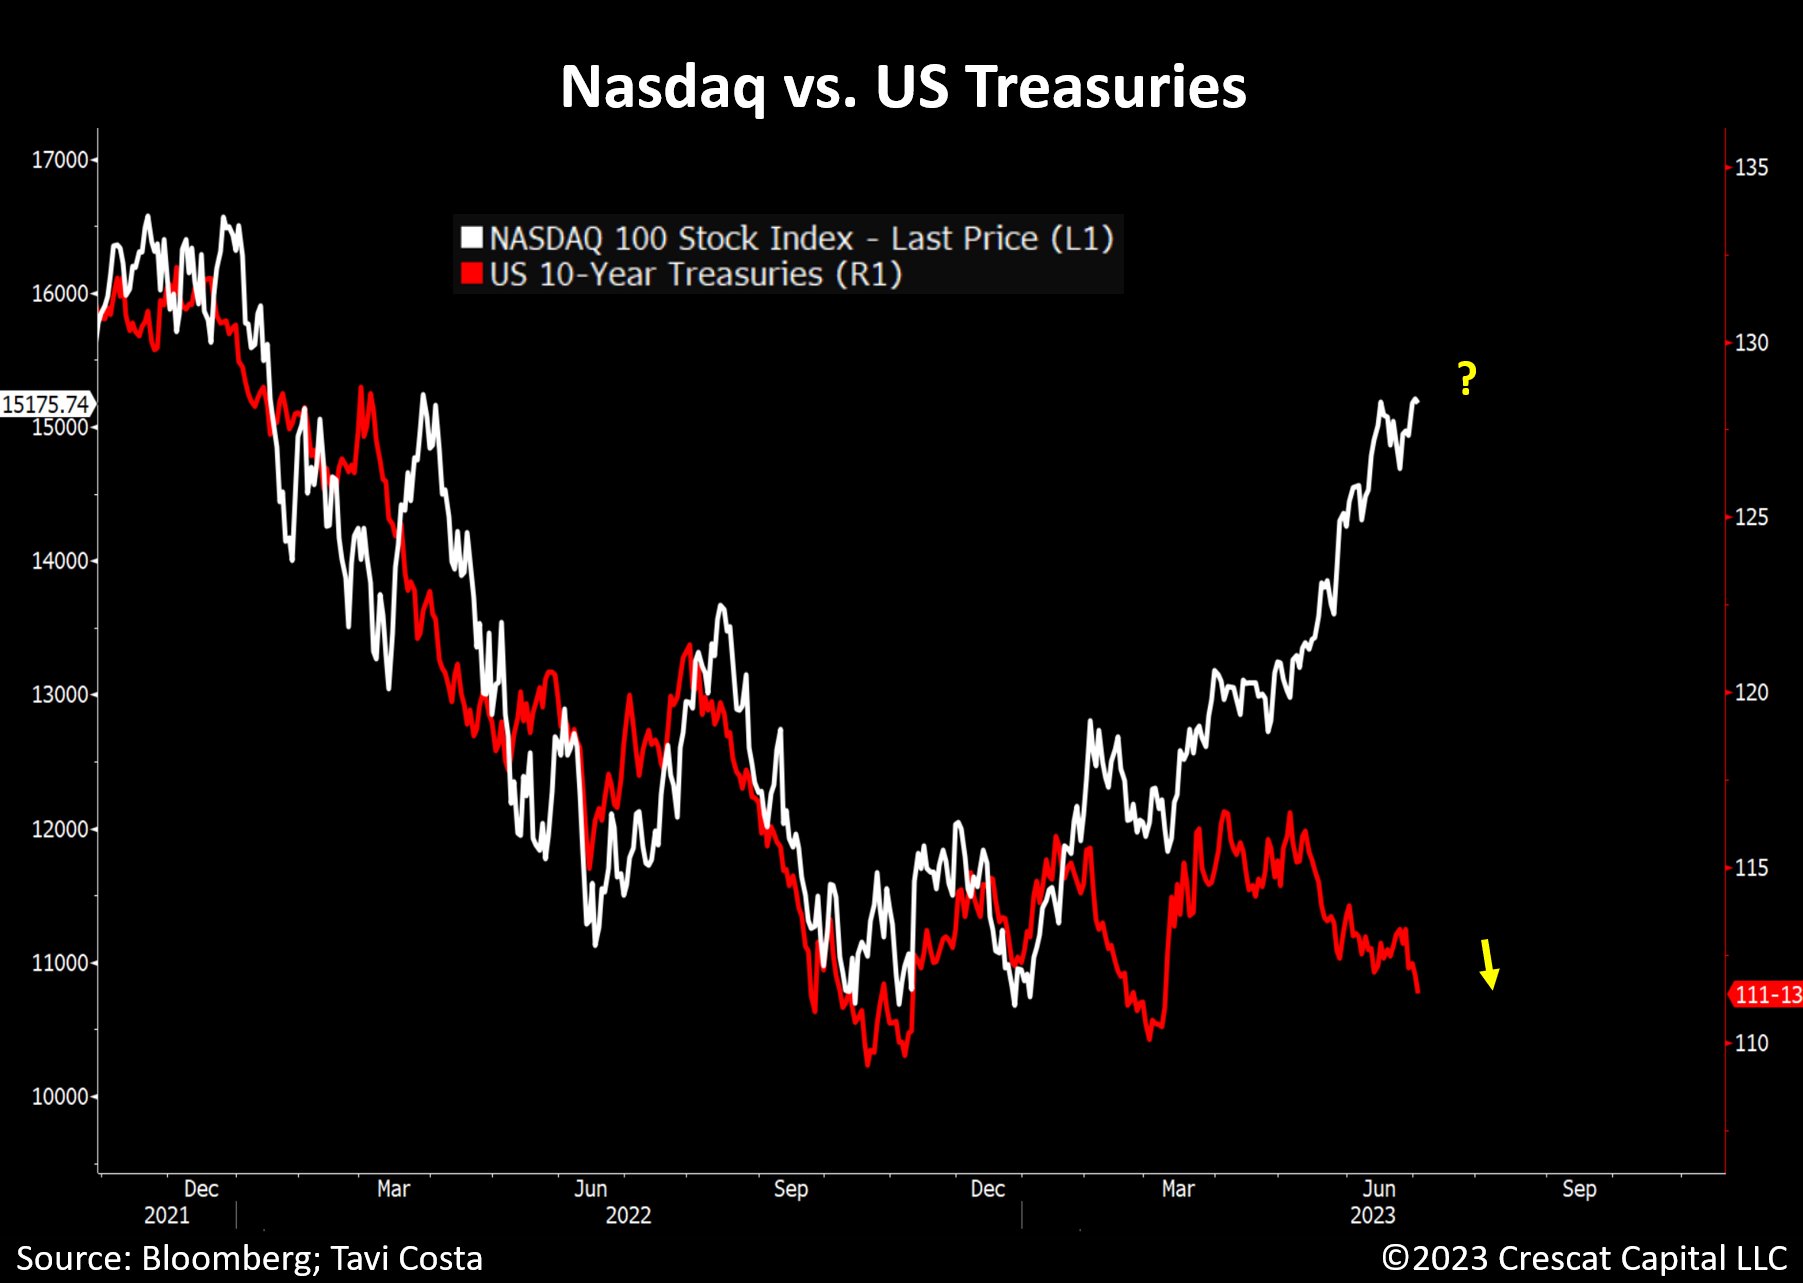
As Otavia Costa from Crescat Capital notes, the NASDAQ 100 is overwhelmingly made up of long-duration tech behemoths. Tech companies are long-duration stocks, meaning they're expected to make the bulk of their money in the future.
If future financing costs (as long-dated bonds are meant to price in) are expected to increase, then the present value of these stocks should be discounted accordingly.
That hasn't happened yet. I feel a correction coming.
2 topics
1 stock mentioned

