TOL - 10th Aug, 2024
What caused stocks to crash, what’s next for markets, and how to defend your portfolio
Just the facts on what’s happening in global financial markets and what you can do about it.
History is littered with new-fangled ways financial boffins found to make a quick buck that eventually crashed the financial system – from tulips to mortgage-backed bonds. But, despite what much of the mainstream financial media has intimated about the carry trade over the last 24-hours, it is not something that big fund managers have been doing recently that suddenly blew up.
You will not see a single reference to “It was the biggest fall since…” in this article. I just want to give you the facts on what’s happening, and what you can do about it.
What is the carry trade and how does it work?
The carry trade involves borrowing in a currency that has a lower interest rate and investing in a currency that has a higher interest rate. The difference after costs is your profit. Usually the variables, such as interest and exchange rates, are reasonably stable and have attached to them highly visible micro and macroeconomic drivers.
It’s a trade of small margins but high certainty. This means to make really big bucks out of the carry trade, you need to apply large amounts of capital. It also means, when some of those highly visible and highly predictable variables suddenly shift – the sheer size of the global carry trade can have significant ramifications for markets.
The carry trade has been around for more than a generation. There are fund managers nearing retirement who on their first day in the office 30 years ago, were taught their firm’s version of the carry trade. It has been the bread and butter of the financial system since the 1990’s when the Bank of Japan embarked on a regime of (then conventionally) ultra-low interest rates in an attempt to stimulate the Japanese economy after crashes in the country’s property and stock markets.
Compared to much of the financial alchemy employed within the financial system, it’s one of the more benign strategies. The problem is that over the last couple of weeks, all the key variables of the carry trade changed far more quickly than expected.
The 3 pillars of this week’s crash
The main funding source of the carry trade is the Japanese Yen. This is because since 1995, it has been associated with the lowest official interest rate among the world’s largest economies. Over this time, fund managers have been able to borrow in Yen and invest anywhere else they can make the carry trade work. So typically, destinations for the carry trade have included higher yielding economies such as the USA, Europe, and it might surprise you – Australia.

This is because the Aussie dollar has consistently been one of the most liquid and highest yielding currencies for the carry trade for a very long time. Given the carry trade involves such huge sums, liquidity is just as valued as yield.
The Aussie dollar was a major target of the carry trade during the period following the US recession of 2001, and through until the late 2010’s as the Australian economy emerged from the GFC far more quickly than the US economy did.
%20and%20Fed%20Funds%20Rate%20(USA).png)
More recently, given the Federal Reserve’s Fed funds rate sitting at a lofty 5.25% compared to up until very recently a -0.1% of Policy Rate at the Bank of Japan (BOJ), the US dollar has been a major destination currency for the carry trade.
Pillar 1: Japanese rates have risen
Glance back up to Chart 1, the BOJ Policy Rate. Note that last little blip right at the end. That’s what much the current fuss is about! The BOJ policy rate has risen twice since February, from -0.1% to 0.1%, and then on Wednesday last week, to 0.25%.
It doesn’t sound like a big move but remember the size of the carry trade and the small margins involved. Also consider the last +0.15% move was largely unexpected (markets had expected the BOJ to remain on hold). The cat is officially among the pigeons!
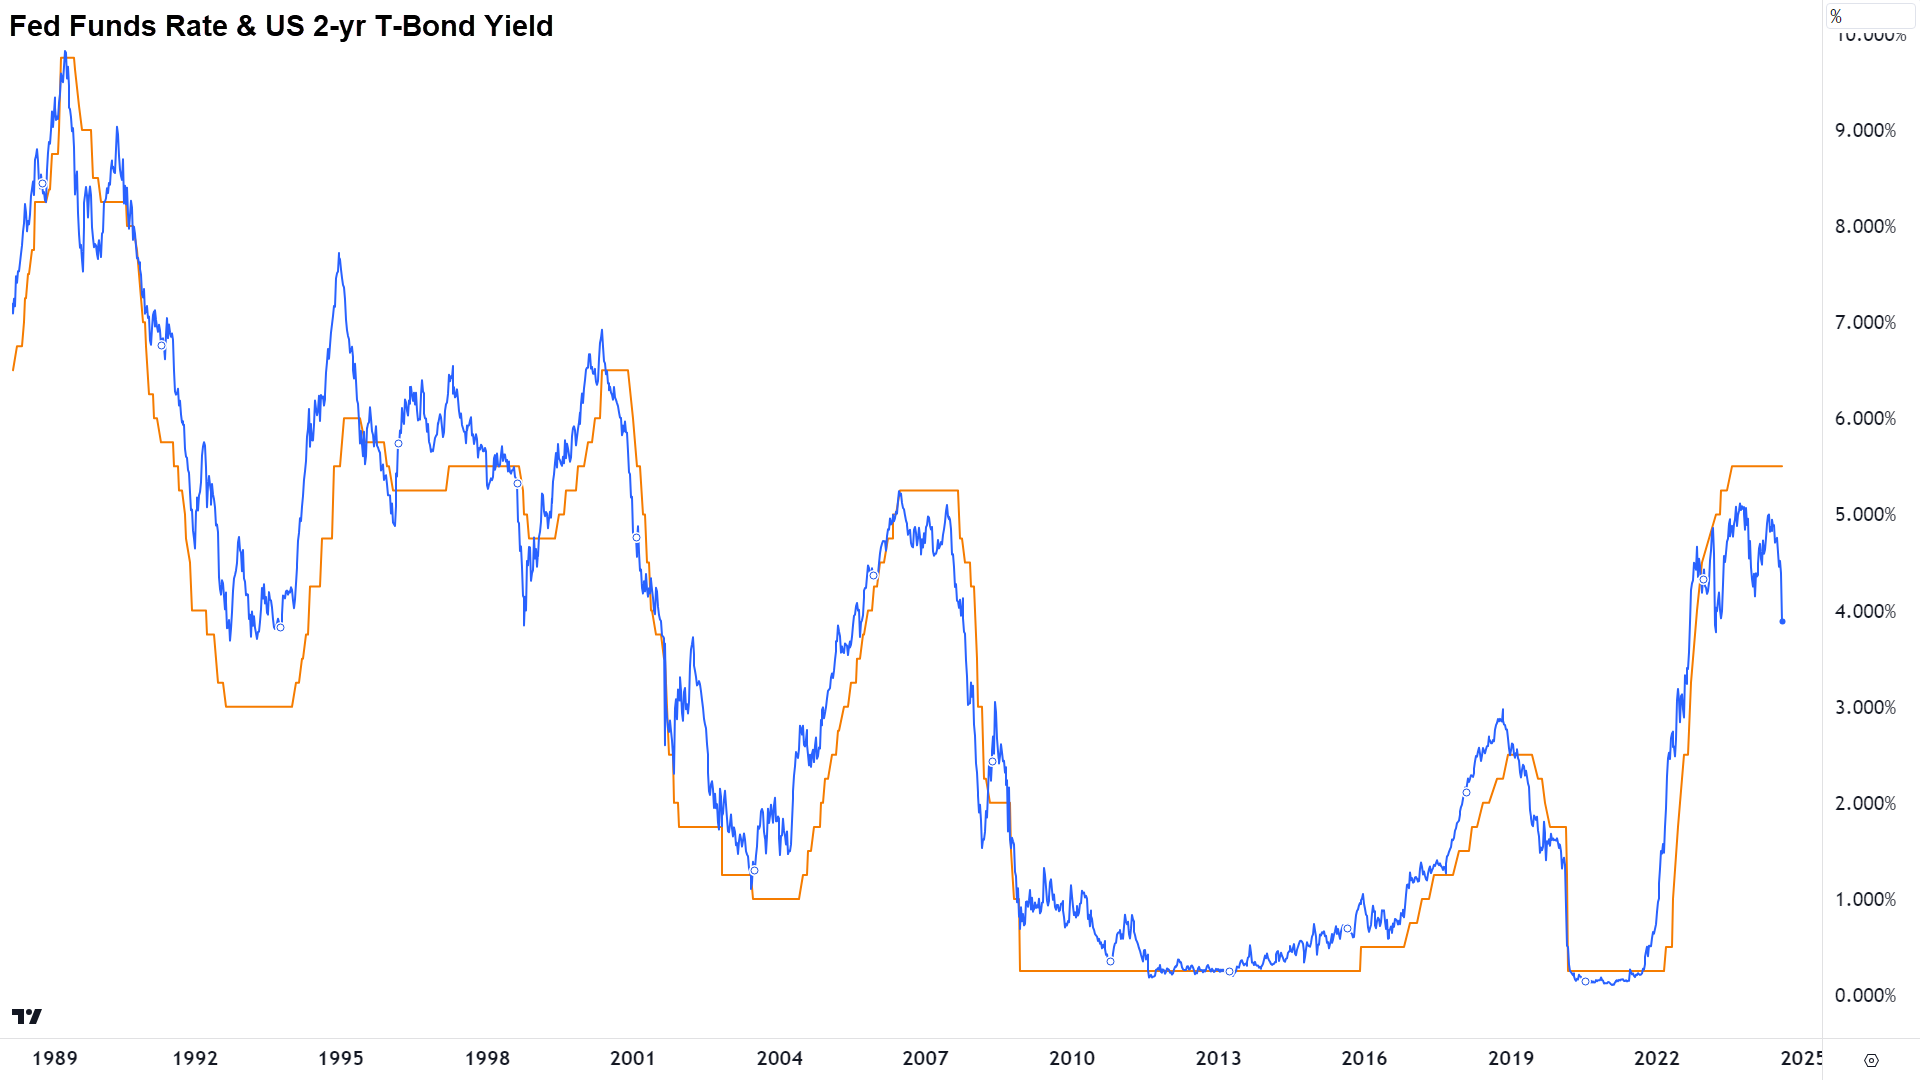
Pillar 2: US Rates have dipped
As is almost always the case when we see coordinated market meltdowns, a few important factors that are relatively harmless by themselves – converge simultaneously to cause financial markets mayhem.
The BOJ rate hike might have turned out to be relatively innocuous if not for this second pillar, the large decline in US market rates.
I reported yesterday that short term benchmark bond yields in the US have tumbled over the past few weeks as weaker than expected US economic data has accelerated market expectations of the timing and magnitude of Federal Reserve rate cuts this year.

The chart above shows just how disconnected short term market yields and the Fed Funds Rate have become. The yield on the benchmark US 2-year T-Bond has dipped from above 5% in May to 3.9% yesterday. That’s 110-basis points shaved off the carry trade in a very short period. Add in the as much as a 15-basis point increase in the equivalent 2-year Japanese Government bond yield – and you have created chaos for carry traders!
It takes time to unwind even just a little bit of the carry trade – and that’s all we’re really talking about this week – an unwind of a small piece of what remains a very big carry trade pie.
Importantly, there’s still what we call “positive carry” between short term market yields in Japan and those in other funding countries like the USA and Australia. This means the trade is still profitable, and therefore the carry trade will carry on. But as markets always do, they look forward. Will the Fed be forced to cut its official rate deeper than markets have already factored in? How far will the BOJ go in its current hiking cycle?
It’s the uncertainty that’s causing the current volatility.
Pillar 3: FX rates have shifted
The coal face of the carry trade is currency markets. The whole point of this trade is to invest the Yen you borrowed on the cheap in higher yielding assets in other countries. This means that when the carry trade is in full swing, we tend to see a very weak yen against most of the other major currencies.
.%20Source%20TradingView.png)
Since the Fed’s liftoff in 2022, the US dollar (USD) has been the key destination for carry trade Yen. This has contributed to a massive appreciation in the USD/JPY. Until the events of the last couple of weeks…
Here’s where it gets interesting for the Japanese stock market. Many of the headlines over the last 48-hours have centred on the “meltdown” in Japanese shares and how this is somehow influencing falls in other stock markets. It is and it isn’t – but I’ll discuss that at the end of the article.
For now, just note that for the last 18 months that Japan’s benchmark index of shares, the Nikkei 225, has been on a tear – and Yen weakness has been the primary driving factor. This is because the Japanese economy is largely export-oriented. A weak yen makes Japanese products more competitive in the global marketplace, and this has translated into strong earnings for many Japanese companies.
%20and%20Nikkei%20225%20Source%20TradingView.png)
Also, and this is a little ironic, the Japanese stock market has likely benefited to some degree from repatriation of carry trade funds in anticipation of a BOJ change in policy – until this week. The sudden and large appreciation of the Yen this week, along with the increase in risk free Japanese Government bond yields, has triggered a rotation out of Japanese equities towards Japanese bonds.
What impact will the carry trade unwind have on Australian shares?
It’s a nice segue from that third pillar here. The answer is potentially much the same impact as on Japanese stocks. The Aussie share market has long been a destination for global investment funds due to its high yield. The average dividend yield on Japanese and US stocks over the last 20 years has been around 1-2%. The average dividend yield on Aussie stocks over this time is closer to 4% – order of magnitude more than double.
This likely explains why many of our high yielding financial stocks were hit so hard in yesterday’s sell off. The S&P/ASX 200 Financials (XFJ) sector was the second worst performing sector, falling 5%. To be fair, though, the carry trade probably explains much of the XFJ’s prior strength – what the carry trade giveth, it taketh away!
You probably won't believe just how much impact the carry trade has on the local stock market until I show you this next chart of the XFJ and the Nikkei 225 over the last 12 months. It starts with a base of 0 and then measures each index's performance in percentage terms. Now, it could be just pure coincidence, or I put to your that the carry trade does more than just skim our financial shores...
%20vs%20S&P-ASX%20200%20Financial%20Sector%20Index%20(XFJ)%20Performance%2012-months.png)
But the carry trade’s impact is far broader than just high yielding assets. It’s anything that’s highly liquid and might deliver a better risk-adjusted return than Japanese Government bonds. So you could potentially add in anything from US mega-cap tech stocks to various ex-Japan government bonds. The reach and therefore the impact of the carry trade is far and wide.
Another place Australia will experience the unwind of the carry trade is in the AUD/JPY exchange rate. It is an unavoidable fact that repatriation of Yen must funnel itself through the AUD/JPY. It has. Forget the few percent Aussie stocks fell Monday, the impact on the AUD/JPY is around 15%.
.%20Source%20TradingView.png)
15% moves in exchange rates in such a short space of time are rare. As in many standard deviations from the mean – and we’re not talking obscure currencies here – the AUD and JPY are two of the most liquid in the global financial system. Make no mistake – something very big happened this week!
This means the chart of the AUD/JPY is going to be a good one to watch over the next few weeks. So too will be the chart of the Nikkei 225. If we both stabilise quickly, there’s a good chance this could all blow over with minimal long-term impact. If they don’t, it could yield longer lasting and more severe impairments for the current bull market in most global stock markets.
Other potential impacts:
Big and sudden falls in markets trigger forced liquidation of funds who are highly leveraged. This selling can trigger more selling, which triggers more selling, etc. leading to cascading falls in market prices.
Losses that mount in one market need to be covered by selling assets in others. It’s all linked together, and it all can happen very quickly in today’s interconnected markets.
Systemic credit risks develop. We don’t want to see headlines over the next few weeks and months that “such and such” has gone to the wall due to their exposure to the currencies or stocks that unravelled this week.
The big investment funds, that is the big pension funds, typically prefer lower volatility to higher volatility. It is possible that they move some capital to cash, or just as damaging to maintaining the upward trend in asset prices – withhold some buying until calmer waters.
This is not the first time markets have had to deal with volatility and uncertainty. Markets are extremely efficient at discounting risks. Prices adjust – like they have – and then they will only adjust to new information. So, it is likely that much of the impact of the factors occurring in the US I discussed in my article yesterday, and here for the carry trade today, have already been factored into prices.
Portfolio defence time!
It's your job as an investor to manage the risk and opportunity that sell offs like the one we witnessed yesterday present. To be forewarned about what is happening in markets, both in terms of causes and effects, is to be forearmed.
I hope I’ve given you a better understanding of how we arrived here, some of the key indicators you must now keep an eye on, and the potential impacts on markets going forward that you may need to defend your portfolio against.
To get a better understanding of what's happening on the US side of the recent markets volatility equation, check out this article: This indicator predicted every US recession for 35 years and it’s flashing a major warning for stocks!
This article first appeared on Market Index on Tuesday 6 August 2024.
Never miss an update
Enjoy this wire? Hit the ‘like’ button to let us know.
Stay up to date with my current content by
following me below and you’ll be notified every time I post a wire
Carl has over 30-years investing experience and has helped investors navigate several bull and bear markets over this time. He is a well respected markets commentator who specialises in how the global macro impacts Australian and US equities. Carl has a passion for technical analysis and has taught his unique brand of price-action trend following to thousands of Aussie investors.
........
Investing is risky. Inevitably you will endure losses. If you can't cope with losing, don't invest.

%20and%20Fed%20Funds%20Rate%20(USA).png)
.%20Source%20TradingView.png)
%20and%20Nikkei%20225%20Source%20TradingView.png)
%20vs%20S&P-ASX%20200%20Financial%20Sector%20Index%20(XFJ)%20Performance%2012-months.png)
.%20Source%20TradingView.png)
5 topics

Carl has over 30-years investing experience and has helped investors navigate several bull and bear markets over this time. He is a well respected markets commentator who specialises in how the global macro impacts Australian and US equities. Carl...
Carl has over 30-years investing experience and has helped investors navigate several bull and bear markets over this time. He is a well respected markets commentator who specialises in how the global macro impacts Australian and US equities. Carl...
Comments
Comments
Sign In or Join Free to comment