TOL - 7th Oct, 2024
What’s in store for Australian shares this October
October gets a bad wrap due to the fact several major crashes occurred during the month, but it’s usually a good period for Aussie shares.
September was an absolute cracker of a month for Australian shares. On a total return basis (considering both dividends and share price appreciation), the All Ordinaries Total Return Index (XAOA) rose 3.45%. This compares to an average month of the year return over the last 40 years of 0.96%, and even more impressive – to the average September return over this period of -0.11%.
That’s right, the typical September is a down month for Aussie shares, and depending on the lookback period, it rivals May as the worst performing month of the year (sell in May and go away!)
We are of course talking about seasonal analysis here, that is, the study of how asset prices tend to behave at certain times of the year. I have written several articles about this topic, the last one you can read here is about what to expect in the “typical” September. It’s a good article to check out, because it details all the key September performance statistics – including just how reliably terrible September usually is.
Which allows me to make my next point!
This September is a fantastic example of how seasonal analysis is simply a guide for investors regarding potential performance. The historical data that tells us September was generally lousy for Aussie shares is just that – historical. Certainly, if there are a set of circumstances that regularly cause a seasonal pattern to occur in the past, they may cause it to occur again in the future – but always remember there are no guarantees.
Seasonal analysis misfired in September. No problems, that can happen. Now on to October! October is often assumed to be a bad month for stocks given several major historical market crashes occurred in this month, but the data suggests this is not the case.
In this article, we will investigate what usually happens in October for Australian shares, but more importantly, what usually happens when September saw a big move – as was the case this year. Let’s dive in!
ASX October seasonality
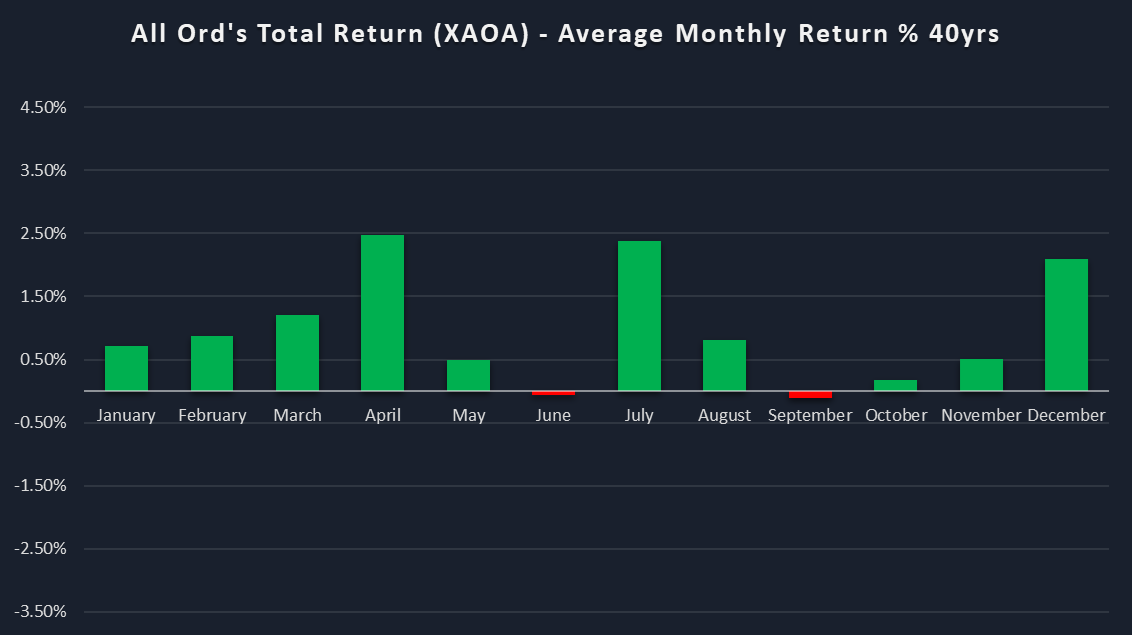
Good news Aussie investors, October is usually a good month for Aussie shares. I keep data on the ASX going back to 1982. Over this period, the average October delivered a +0.12% return. Modest, yes, but not a stinker as most may have believed. The tenth month of the year often gets a bad wrap because it hosted the 1907, 1929, and 1987 crashes, as well as kicking off the GFC in 2008.

I don’t have ASX data going back to 1907 and 1929, but I can tell you that the XAOA dropped 42.1% (not a misprint 🤯) in October 1989 and 13.9% in 2008. If you remove these two “outliers” from the sample, that +0.12% becomes +1.52%. There was also a -10.4% October during the Asian Financial Crisis of 1997. If you take this one out too, October’s average performance since 1982 comes in at a very impressive +1.8%.
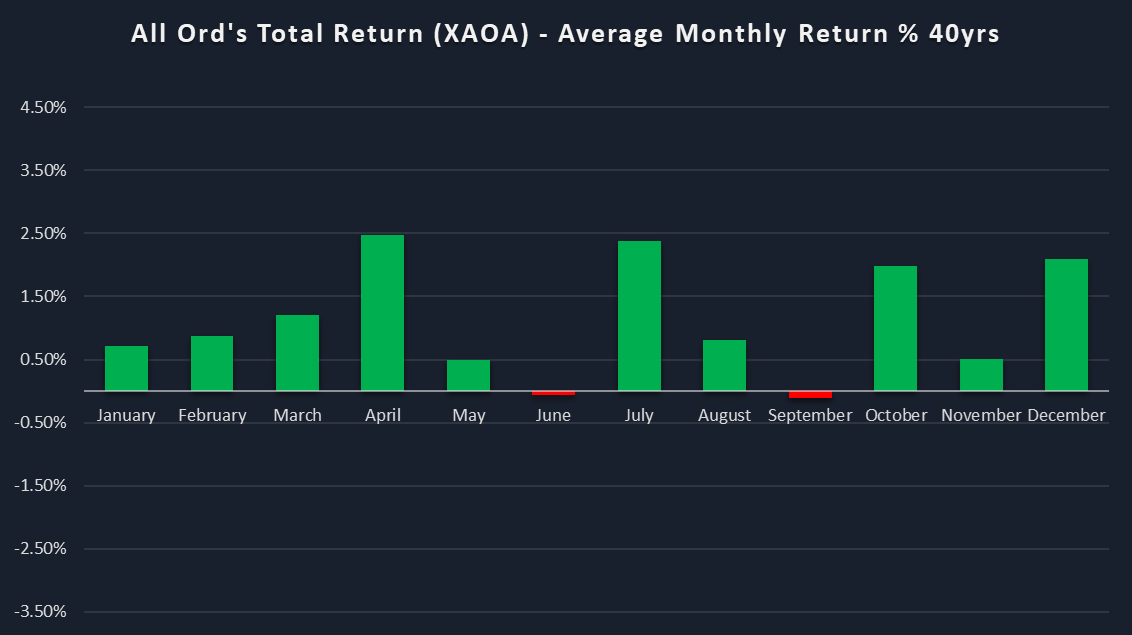
Whether you agree with those omissions is up to you, but one could argue the “typical” October is actually one of the better months of the year for Aussie shares. In fact, it would be fourth best since 1982 after April (+2.47%), July (+2.37%), and December (+2.09%).
%20-%20Average%20Monthly%20Return%20-%2040yrs%20%E2%80%93%20October%201987,%201997%20and%202007%20removed.png)
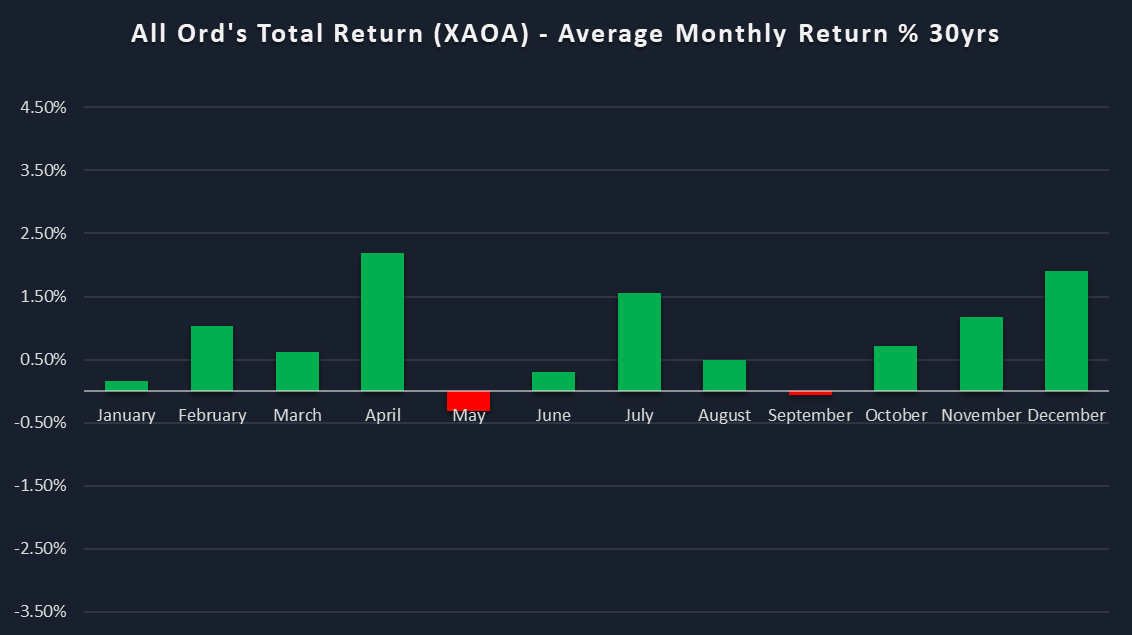
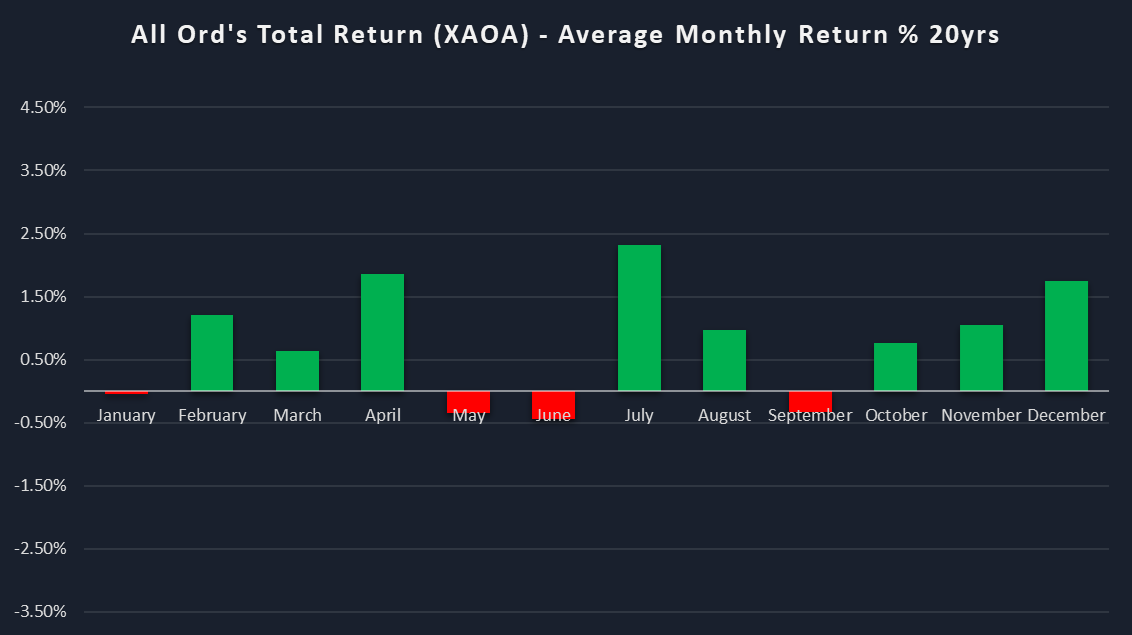
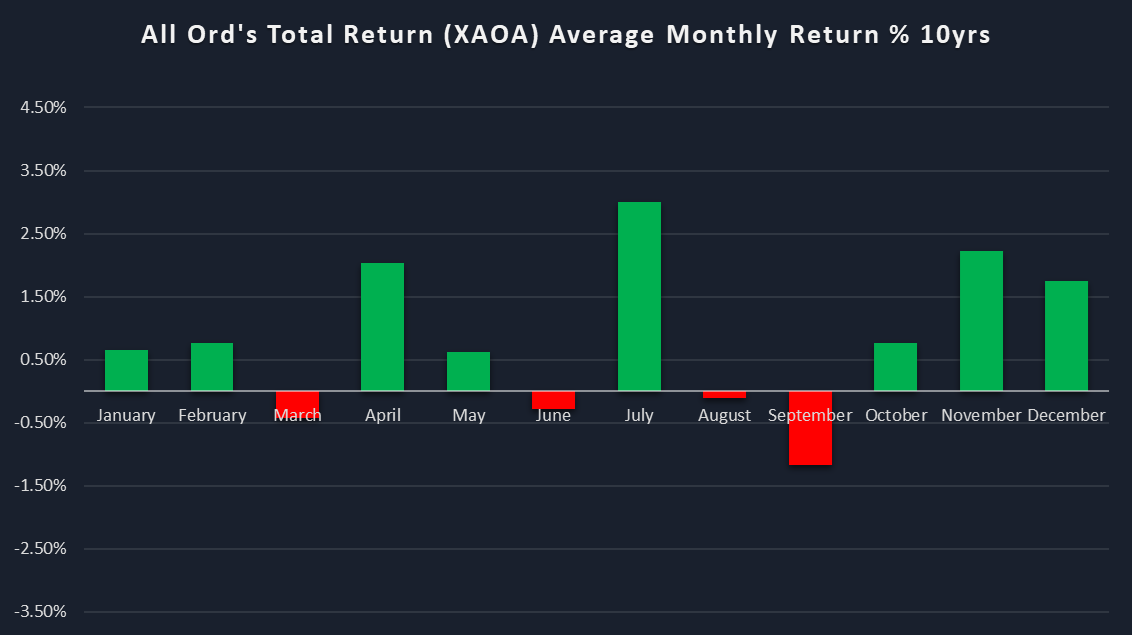
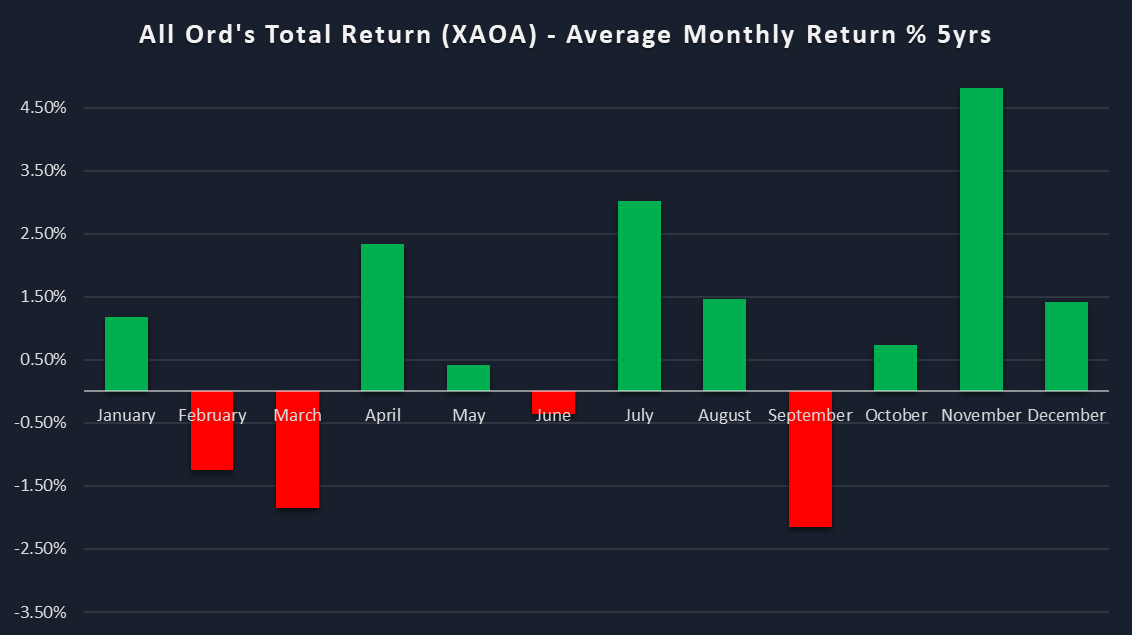
It’s always important to consider seasonal performance over a range of lookback periods. This can help us to see if a pattern that has been reliable over longer lookback periods is as consistent or waning over shorter lookbacks. Seasonal patterns can and do change. In this regard, see below the seasonal charts for the XAOA over 30, 20, 10, and 5 year lookback periods (no outliers have been removed).

All Ord's Total Return (XAOA) - Average Monthly Return % 30yrs (click here for full size image)

All Ord's Total Return (XAOA) - Average Monthly Return % 20yrs (click here for full size image)

All Ord's Total Return (XAOA) - Average Monthly Return % 10yrs (click here for full size image)

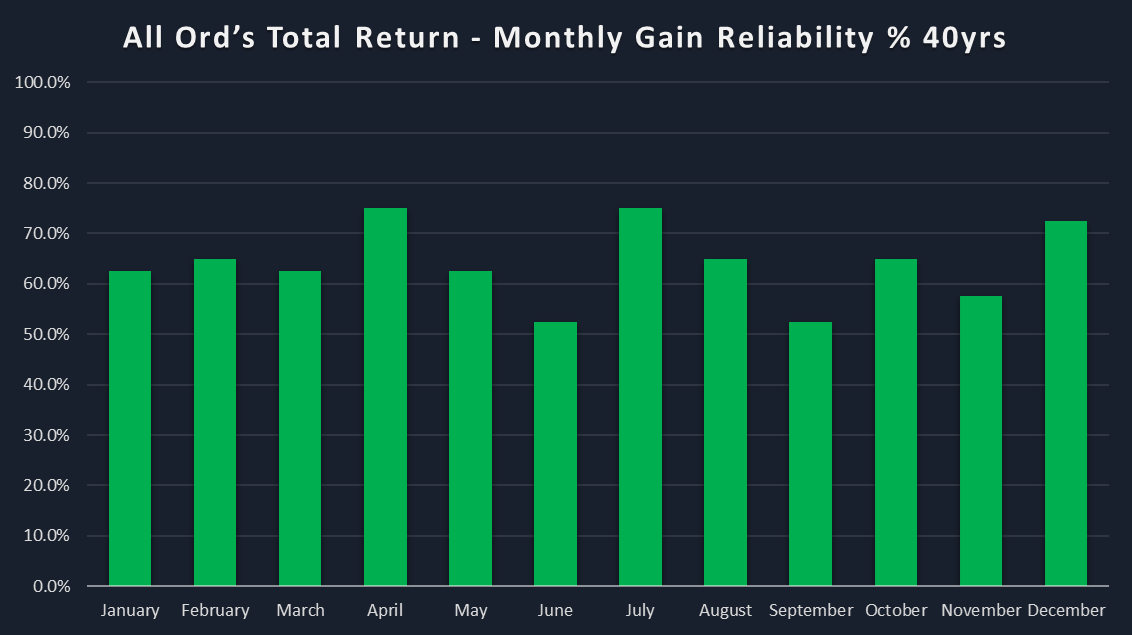
It’s also worth noting that October is also one of the more reliable months of the year, that is, for delivering a positive return of any amount. Over the last 40 years, October has delivered a positive return 65% of the time. The XAOA’s monthly gain reliability over this period is shown in the chart below, and for brevity, I will simply state its other lookback period reliabilities: 30 years: 66.7%, 20 years: 65%, 10 years 60%, 5 years: 60%.
%20-%20Monthly%20Gain%20Reliability%20-%2040yrs.png)
ASX October seasonality controlling for September 2024
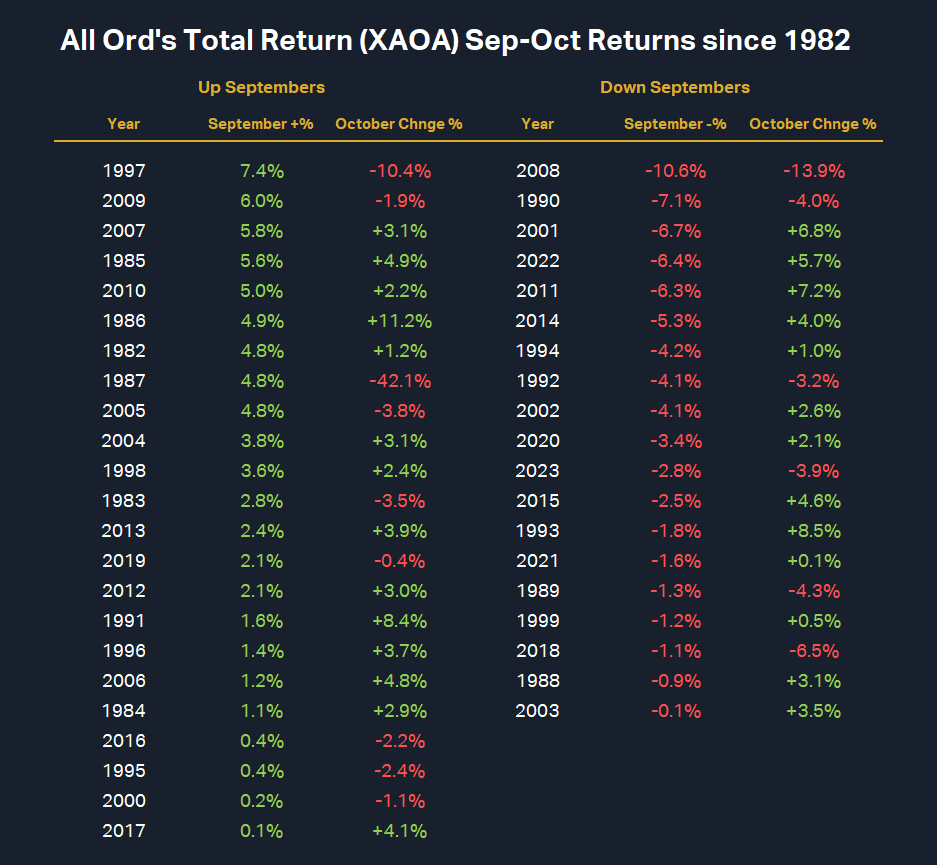
%20Sep-Oct%20Returns%20since%201982.png)
The table above shows every September-October performance for the XAOA since 1982. Here are some statistics to note regarding September:
Up Septembers
Count: 23
Average Up September: +3.1%
Standard Deviation Up Septembers: 2.1%
Down Septembers
Count: 19
Average Down September: -3.1%
Standard Deviation Down Septembers: 2.7%
The standard deviation of all Septembers is 4.1%. So, whilst this September’s +3.45% return may seem substantially greater than the average September return of -0.11%, it's within one standard deviation of that mean. This suggests it’s not particularly extraordinary among Septembers in the sample.
If we just consider just up September years, these averaged +3.1% with a standard deviation of 2.1%. This also points to this September being fairly typical as far as up Septembers go. I suggest given this is the case, we can simply look at how Octobers tend to perform in general after up and down Septembers. I will include for your interest, however, data on up Septembers that delivered a return at least as big as this September. Here are the statistics:
October vs Up Septembers
Average All Octobers: -0.4% (Removing 1987: +1.5%, Removing 1987 + 1997: +2.1%)
Average Octobers vs 2024 September or better: -2.8% (Removing 1987: +1.2%, Removing 1987 + 1997: +2.5%)
October vs Down Septembers
Average: +0.7% (Removing 2008: +1.5%)
Conclusions
There does appear to be a modest underperformance in Octobers that follow Septembers that delivered positive performance (-0.4%), while Octobers that follow Septembers that delivered negative performance appear to outperform (+0.7%).
However, the data is significantly skewed by the occurrence of October 1987 in the sample (and to a lesser extent, also by 1997). Adjusting for these, one could conclude that strong Octobers do tend to follow strong Septembers (+2.1% average return). This improves slightly to +2.5% when accounting for Septembers that delivered gains greater than or above the 3.45% return logged this September.
If this October is to turn out as per seasonal trends since 1982, then it will likely result in another gain for the Australian share market. As always, we should be cautious about extrapolating historical data into the future. But, if we collect good data, and are sensible in our analysis and assumptions, we may have greater confidence that a particular seasonal pattern may continue into the future.
This article first appeared on Market Index on Wednesday 2 October 2024.
Never miss an update
Enjoy this wire? Hit the ‘like’ button to let us know.
Stay up to date with my current content by
following me below and you’ll be notified every time I post a wire
Carl has over 30-years investing experience and has helped investors navigate several bull and bear markets over this time. He is a well respected markets commentator who specialises in how the global macro impacts Australian and US equities. Carl has a passion for technical analysis and has taught his unique brand of price-action trend following to thousands of Aussie investors.
........
Investing is risky. Inevitably you will endure losses. If you can't cope with losing, don't invest.

%20-%20Average%20Monthly%20Return%20-%2040yrs%20%E2%80%93%20October%201987,%201997%20and%202007%20removed.png)
%20-%20Monthly%20Gain%20Reliability%20-%2040yrs.png)
%20Sep-Oct%20Returns%20since%201982.png)
5 topics

Carl has over 30-years investing experience and has helped investors navigate several bull and bear markets over this time. He is a well respected markets commentator who specialises in how the global macro impacts Australian and US equities. Carl...
Carl has over 30-years investing experience and has helped investors navigate several bull and bear markets over this time. He is a well respected markets commentator who specialises in how the global macro impacts Australian and US equities. Carl...
Comments
Comments
Sign In or Join Free to comment
most popular
Equities
The Magnificent Seven can’t carry the market forever
Pzena Investment Management