TOL - 11th Oct, 2024
What’s in store for iron ore this November and December
The iron ore price dived and surged in just a few weeks, as did prices of ASX iron ore miners. What usually happens in the last quarter?
Iron ore prices have been on a tear lately, as new stimulus measures announced by Beijing last month aimed at stoking the Chinese economy have filled investors with renewed optimism over Australia’s biggest export. ASX-listed iron ore miners have also experienced a solid recovery, but to varying degrees as per the chart and accompanying table below.

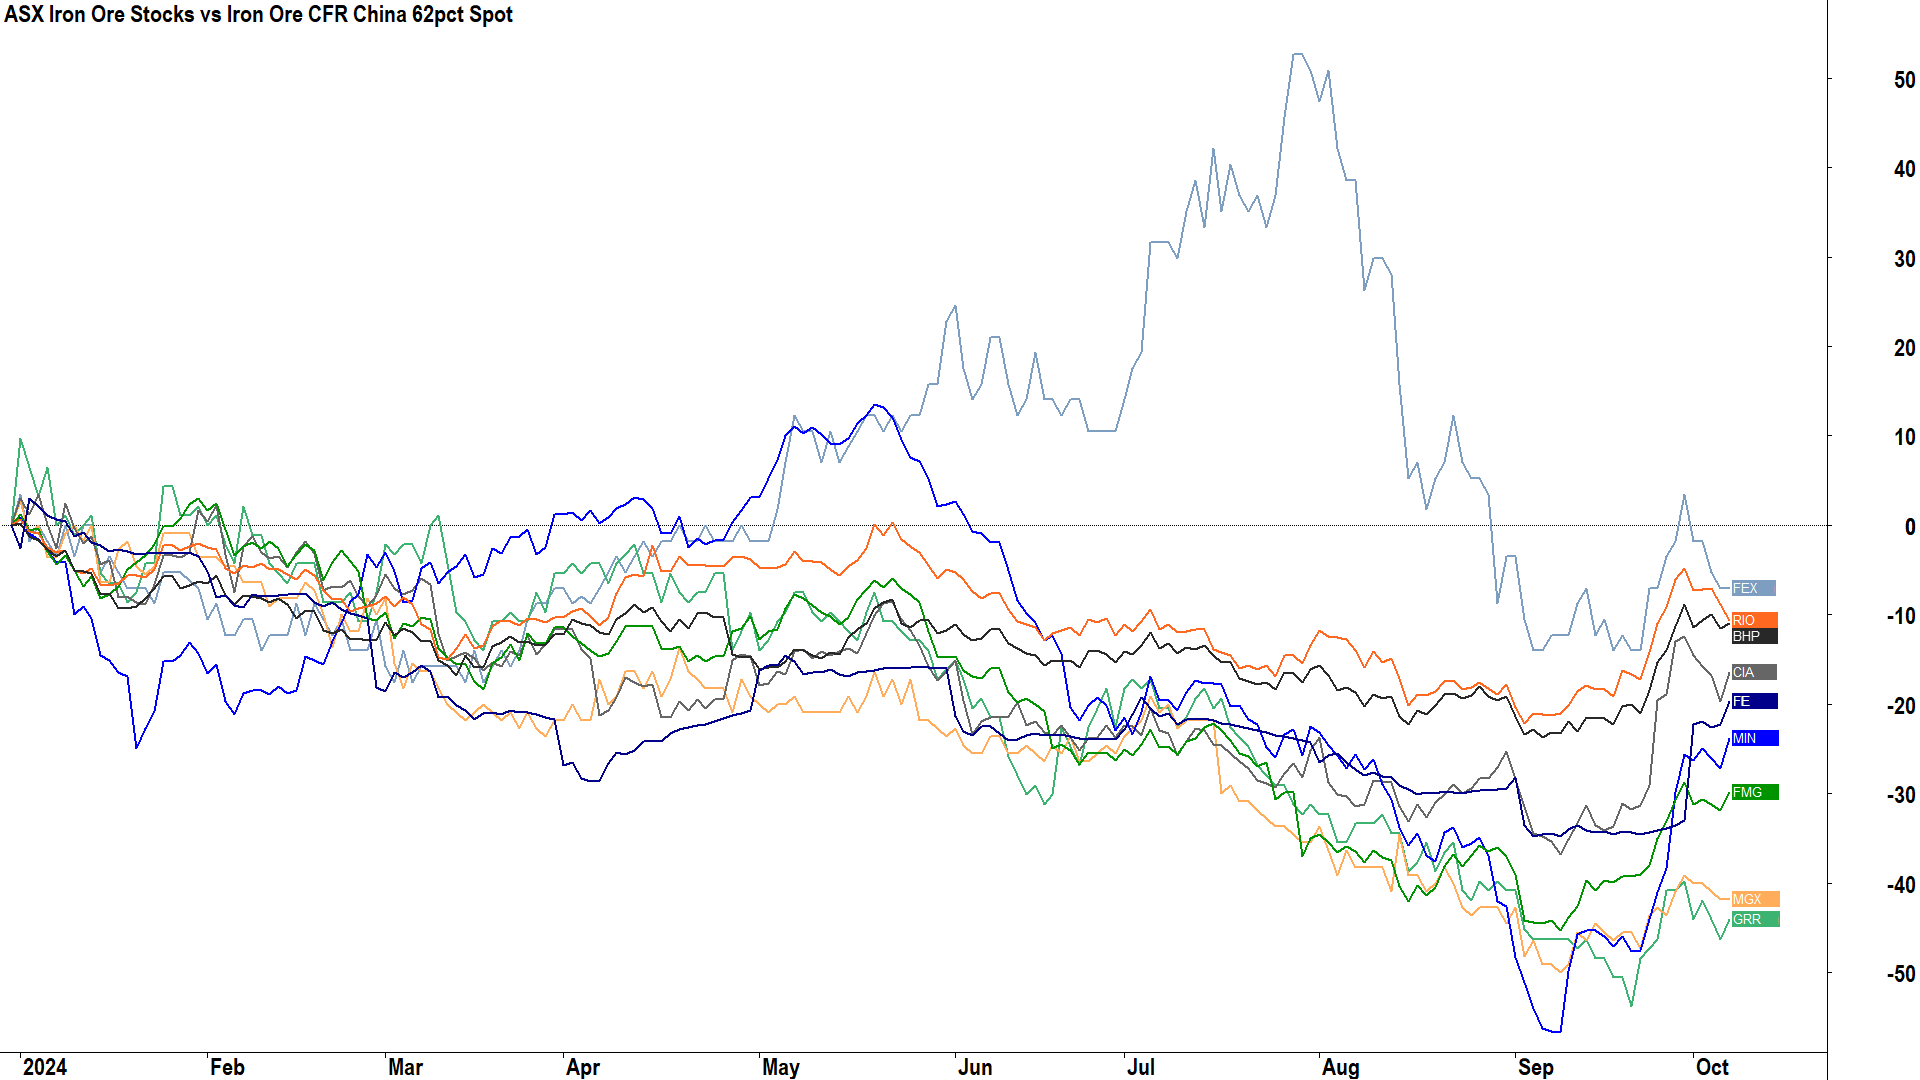
ASX Iron Ore Stocks vs Iron Ore CFR China 62pct Spot percentage performance in 2024 (click here for full size image)

For companies that also produce other minerals, like BHP Group (ASX: BHP), Rio Tinto (ASX: RIO), and Mineral Resources (ASX: MIN), the recovery from the September low has been incongruous with the iron ore price recovery, likely reflecting the relative fortunes of the other parts of these company’s respective businesses. Of the other major ASX iron ore producers, pure play Fortescue (ASX: FMG) perhaps has not surprisingly has tracked the recovery in the iron ore price almost exactly.
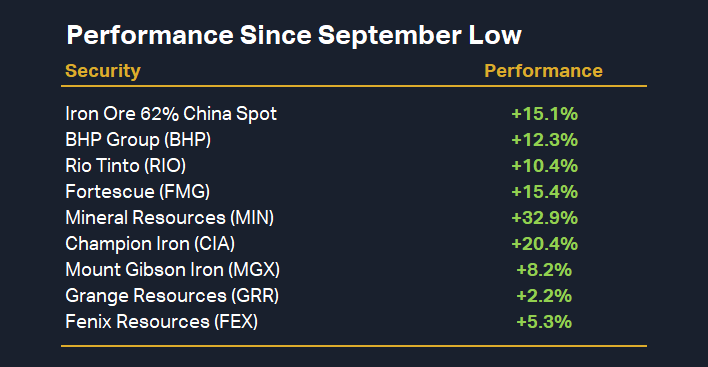
In the smaller capitalisation producers, Champion Iron (ASX: CIA) is the clear standout with a 5.3% outperformance of the iron ore price move, whilst relative minnows Mount Gibson Iron (ASX: MGX), Grange Resources (ASX: GRR), Fenix Resources (ASX: FEX) have lagged poorly.
The stunning September turnaround in the Iron ore price reflects the substantial surprise element of the recently announced stimulus measures by the People’s Bank of China (PBOC) and the subsequent promises of further monetary and fiscal measures to come by officials in Beijing. Investors in resource stocks all over the world have reaped the rewards. But is this due to shrewd investment management, or is it a case of just plain luck?
I conduct regular technical analysis on the iron ore price in the ChartWatch section of the Evening Wrap series I write for Market Index. As much as the market might have been surprised by recent news events, in ChartWatch the rally was anticipated to a large degree. This article will consider how I was able to anticipate the recent iron ore price rally, including consideration of both trend-based and seasonal technical analysis factors.
Intervention or just seasonality?
%20SGX%20chart%208%20oct.png)
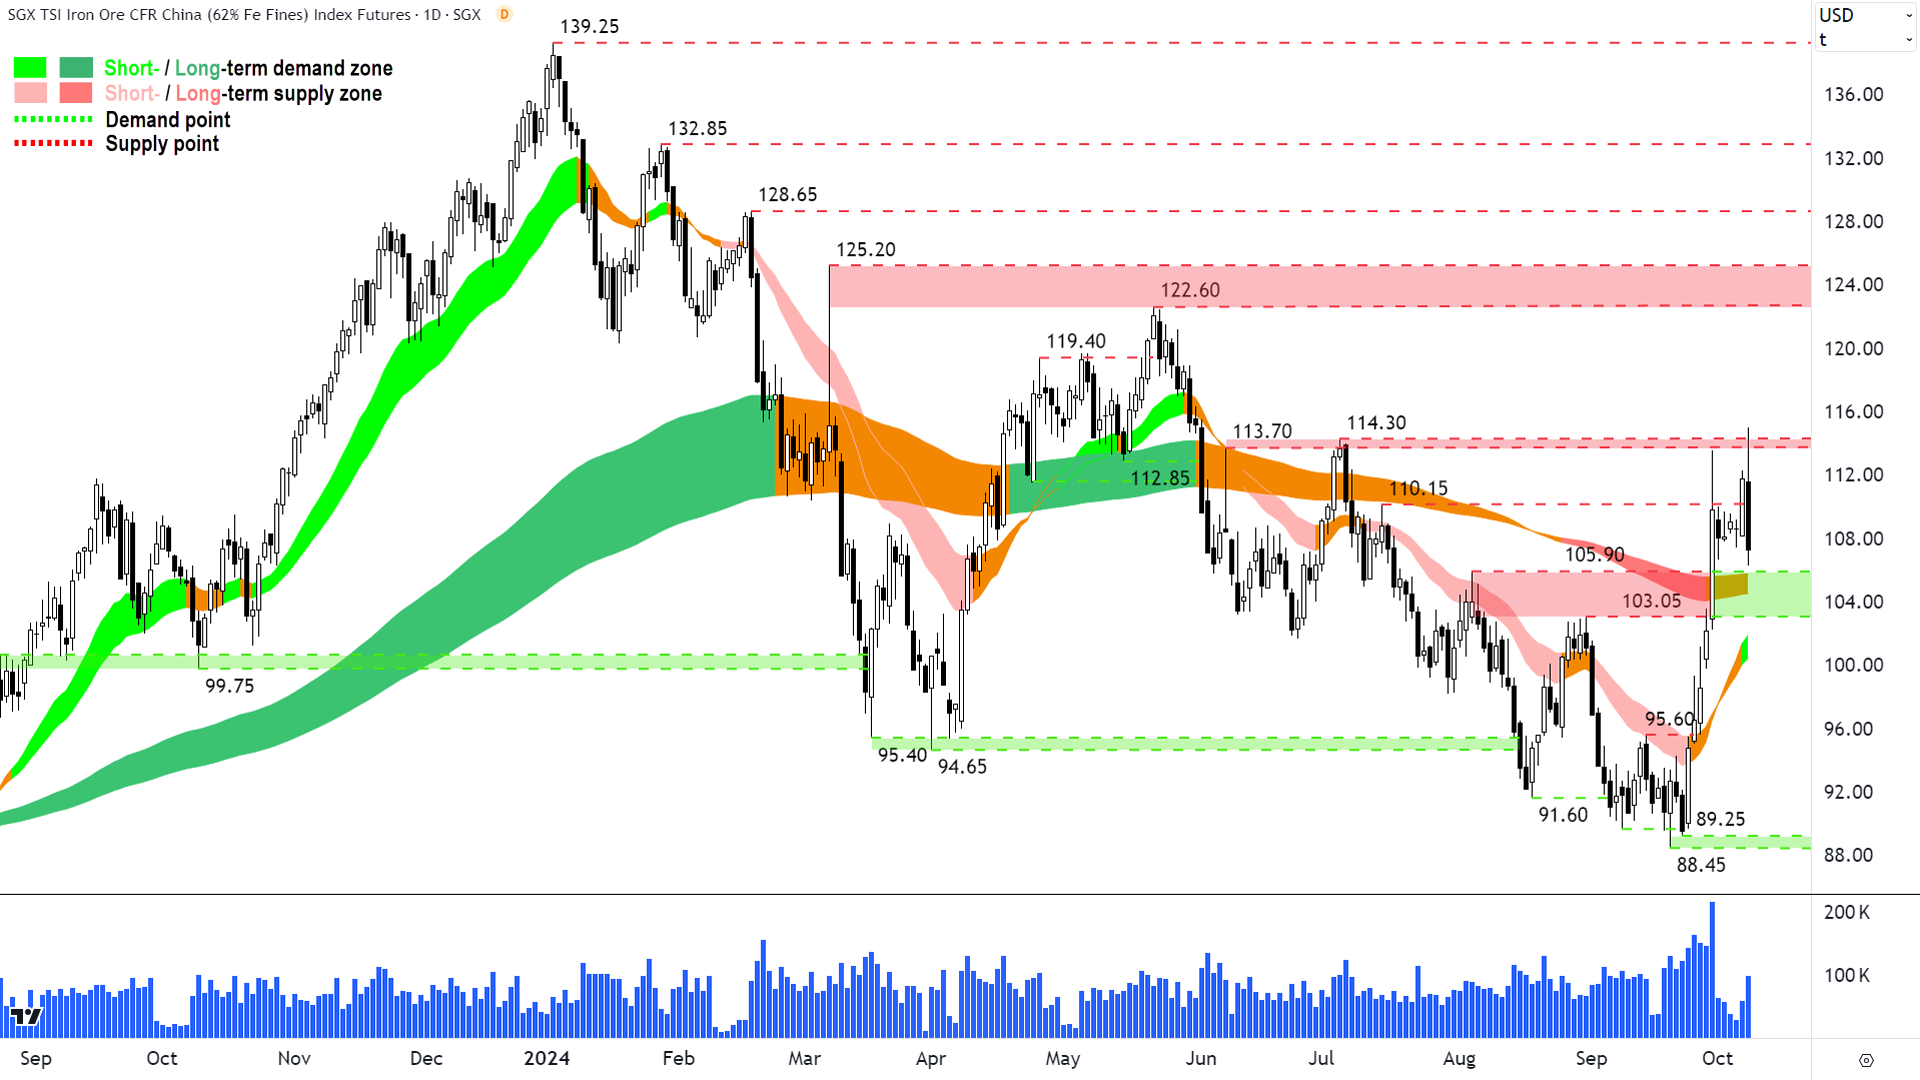
The chart above is the standard marked-up chart of iron ore we use in ChartWatch. Note that prior to the China stimulus measures announced by the PBOC on 25 September, the short and long term trends were well-established to the downside. Worse, the iron ore price had closed and was sustaining below the April low, and candles, price action, and trend ribbons each indicated a wall of excess supply. Up until the 25 September PBOC announcement – all a trend follower could surmise from the technicals is that the iron ore price was likely set for further falls.
Still, my analysis in Chartwatch spoke of a “race against time” between those prevailing bearish technical trends and a potentially massive impending “seasonal rally”. Seasonality is the tendency of the prices of certain assets to move in a consistent way at certain times of the year. It’s particularly prevalent in agricultural commodities whose production is heavily dependent on seasonal weather patterns, but it can also occur in other assets like stocks.
The end of year iron ore seasonal rally is one of the most powerful seasonal moves in financial markets, and it’s one I’ve been tracking for many years now. Seasonality in the iron ore price corresponds to the seasonal nature of Chinese steel production – iron ore being one of the major inputs in the steel making process – and China being one of the world’s biggest steel producers.
Chinese steel mills aim to have their product ready for the peak construction periods in March to June and September to November. This means they tend to stock up on iron ore between November to February and in June-July. Similarly, it also means there tends to be less demand for iron ore around those peak production times.
These are generalisations, and each year, conditions across the broader Chinese economy, conditions within the key property and infrastructure sectors, and even the weather can cause iron ore consumption to differ from the usual pattern. But, for the most part, the highly seasonal nature of Chinese iron ore consumption leads to a similarly highly seasonal iron ore price.

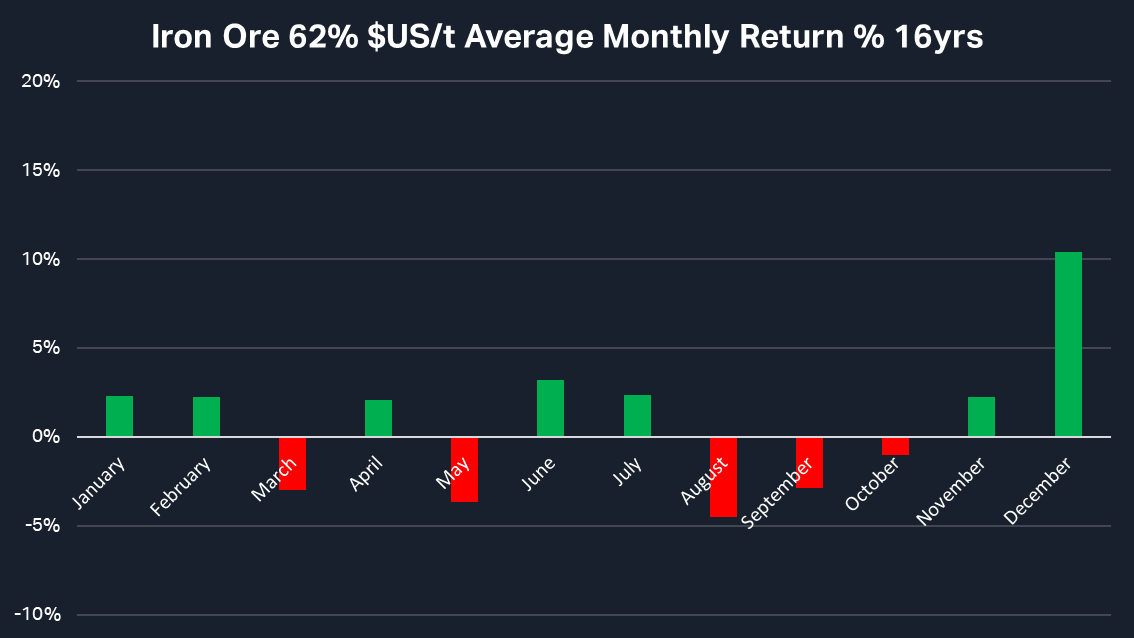
The above chart demonstrates the average performance of the iron ore price for each month of the year over the last 16 years. This might seem like an odd lookback period, particularly when in a recent article on seasonal trends in Australian shares I used data going all the way back to 1982 – but note here the 62% iron ore spot price is a relatively new concept. Prior to 2008, prices were set directly between Chinese mills and miners and weren’t always disclosed publicly.
The iron ore seasonal chart shows strong performances in November and December, but really, the whole period between November and February can be considered a seasonally strong time of the year. There’s also another solid two-month period in June-July. The period between August and October tends to be the weakest period of the year seasonally for the iron ore price, and there are also poor performances in the months of March and May.
If we think back to the seasonal nature of Chinese steel production, we can see now that steel mills tend to ramp up their stockpiling of iron ore in advance of the March-June peak construction period, causing the November-February rally, and ahead of the September to November peak construction period, causing the June-July rally. It is very likely that the rush to get ahead of production ahead of the Lunar New Year holiday which typically occurs in late January or early February exacerbates the strength in the iron ore price typically observed in December.
When Chinese steel mills are fully stocked and in full-swing production, they naturally tend to purchase less iron ore. This explains the weakness in March and likely May – although I have no explanation for why April is skipped – as well as the weakness in August through to October.
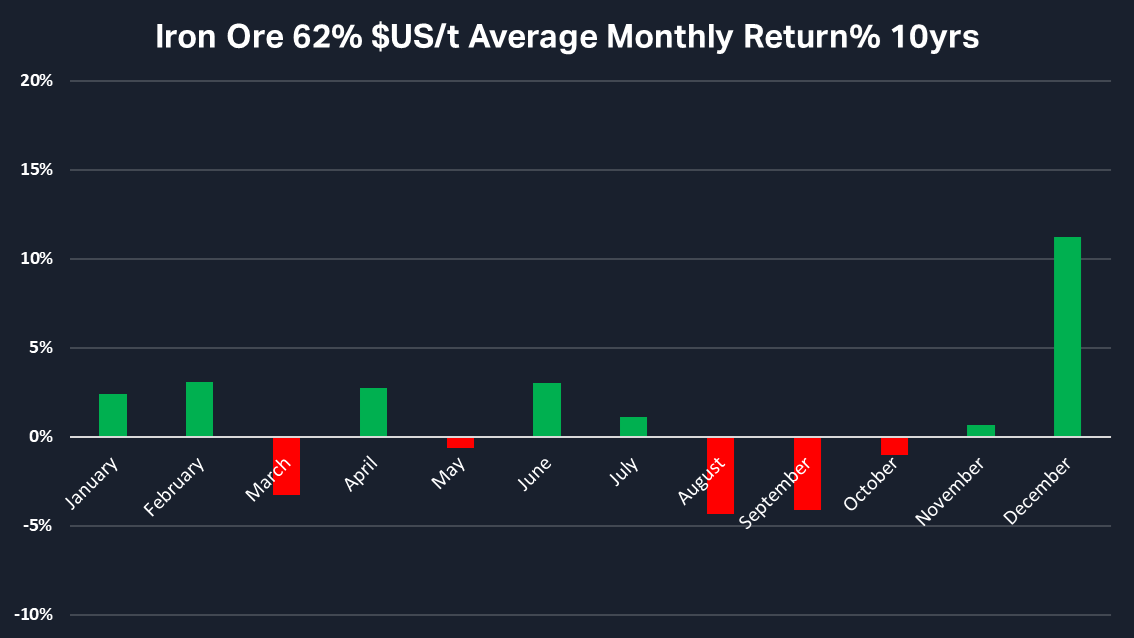
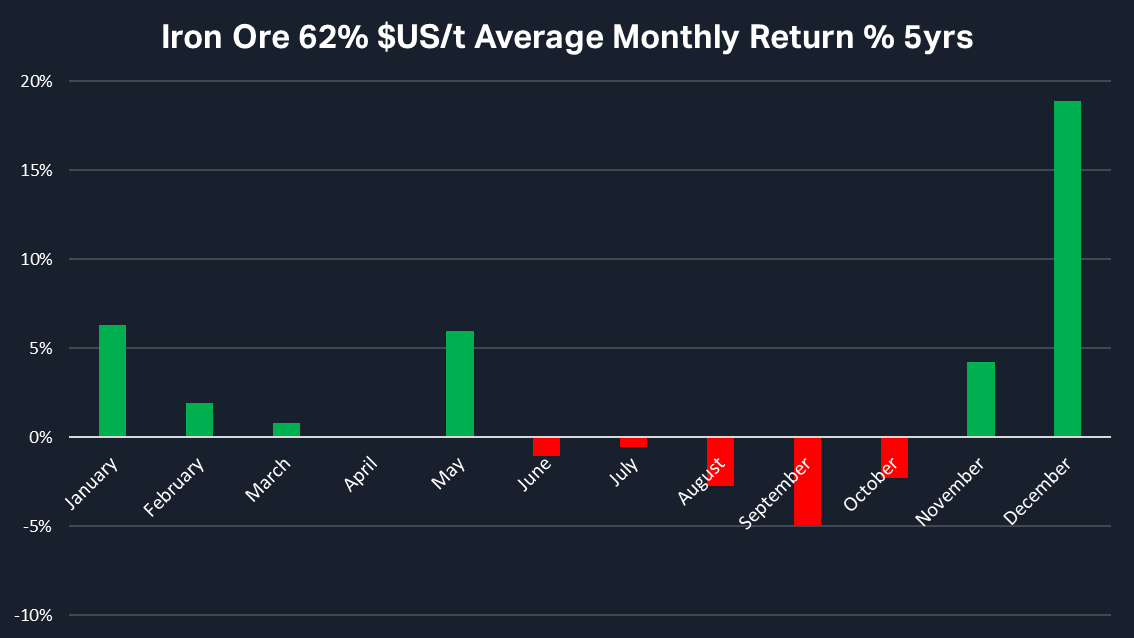
It’s important in seasonal analysis to consider shorter lookback periods also. This can help us understand if a particular seasonal trend is potentially changing. See below the iron ore seasonal charts for the 10-year and 5-year lookback periods respectively.


The seasonal trends in the iron ore price appear to be largely intact in both shorter lookback periods with the exception of the expected weakness in May – it’s not as weak in the 10-year lookback period and it’s actually a strong month in the 5-year lookback period. There are other modest differences but they are mostly seen in the shorter 5-year lookback period, and it’s important to remember that 5 years is a very short period within which to create new trends.
For what it’s worth, however, there does appear to be a potentially a changing trend in how the iron ore price behaves in March and May, and the August-October seasonal slump appears to start earlier to eliminate the June-July rally. With respect to recent March/May strength, it is possible the November rally is simply extending through to these months. As for the elimination of the June-July rally, this is most likely a result of the marked worsening in conditions in the Chinese property sector in recent years.
One key theme that remains unnervingly consistent during each lookback period is the strength in the iron price between November and February. This is perhaps the most interesting takeaway of today’s analysis considering we’re now in the second week of October. When you add the recent technical turnaround in the iron ore chart, as well the promises of more stimulus measures from Beijing – a continued rally in the iron ore price into year end is a highly credible possibility.
But! Before you run out and load up on those ASX listed iron ore stocks we mentioned earlier, please consider these two points:
1. Seasonal analysis is based on historical data and there is absolutely no reason why something that occurred in the past – even with 100% accuracy – should ever occur again. Seasonal analysis is merely a tool, a guide to help us understand what might happen. We should continue to overlay other forms of analysis, including technical and fundamental, to help confirm our predictions.
2. Just because the iron ore price appears to be highly seasonal, this does not mean that the prices of say, BHP, RIO, and FMG, are also seasonal in response. There are no free lunches in markets and iron ore price seasonality is well known, and therefore it is widely anticipated. Assets across the spectrum of the iron ore sector are priced accordingly. It might be the case that the upcoming seasonal rally in the iron ore price is already factored into the prices of iron ore stocks.
On that last point, the only way to find out if ASX iron ore stocks also have a seasonal element to their pricing – is to do the research. But this is a topic for another day!
This article first appeared on Market Index on Wednesday 9 October 2024.
Never miss an update
Enjoy this wire? Hit the ‘like’ button to let us know.
Stay up to date with my current content by
following me below and you’ll be notified every time I post a wire
Carl has over 30-years investing experience and has helped investors navigate several bull and bear markets over this time. He is a well respected markets commentator who specialises in how the global macro impacts Australian and US equities. Carl has a passion for technical analysis and has taught his unique brand of price-action trend following to thousands of Aussie investors.
........
Investing is risky. Inevitably you will endure losses. If you can't cope with losing, don't invest.

%20SGX%20chart%208%20oct.png)
5 topics
8 stocks mentioned

Carl has over 30-years investing experience and has helped investors navigate several bull and bear markets over this time. He is a well respected markets commentator who specialises in how the global macro impacts Australian and US equities. Carl...
Carl has over 30-years investing experience and has helped investors navigate several bull and bear markets over this time. He is a well respected markets commentator who specialises in how the global macro impacts Australian and US equities. Carl...
Comments
Comments
Sign In or Join Free to comment
most popular
Equities
6 big questions and one clear message for investors - stay long
Centennial Asset Management