Why the path ahead favours income assets
The post-COVID period (2022 to mid-2023) for asset markets has now passed. So, too, has the environment of ridiculously low interest rate settings we saw in the period between the GFC and the pandemic, which created an immense speculative asset inflation cycle.
What does this mean for investors?
In examining the consequences, let's look at how these affect the short-term returns from the property asset class.
Let's assume a property asset (valued at $1 million) was acquired with gearing of 50% (equity of $500,000 and debt of $500,000). Let’s also assume that the total gross rental flow from the asset was 6% ($60,000) and the cost of debt was 4% ($20,000 on 50%).
In 2022 terms, the cash flow generated on the equity of $500,000 is net $40,000 ($60,000 minus $20,000), giving a geared 8% cash return on equity. The original equity contribution of $500,000 is revalued in the market and may reach $650,000 – representing a 6% yield.
Re-running the above numbers with some basic assumptions for movements in rents and interest rates, in line with what’s occurred in 2023/2024, shows the following:
- The property assets now return $65,000 (inflation-adjusted rent) and the cost of debt has risen to 7% ($35,000). Immediately we can see that, despite the rising rents, the net income to equity has reduced from $40,000 to $30,000 because of the higher cost of debt.
- The market value of the equity falls back towards $500,000 – assuming the same 6% net yield. If the market requires a higher return from the property, for example, because higher returns are now available elsewhere, then the total market value of the property may well fall below $1 million and the equity value below $500,000.
The above example explains how rising interest rates, driven both by inflation and the response of central banks, cause adjustments to the income flows and market values of most assets. Investors must understand this interaction and reflect on the likely consequences of higher investment hurdle rates.
Understanding this interplay helps explain how extreme market behaviour or pricing can be suddenly halted or reversed. Importantly, it puts into context the past when compared to the present and guides investment decisions.
Will elevated rates cause a repeat of the 1987 market crash?
Today’s markets are nowhere near the extremes seen before the 1987 crash, as shown in the below chart published in early October 2023. For example, while today’s price-to-equity ratios (PERs) are comparable to 1987, back then bond yields were significantly higher.
In addition, we saw an extraordinary surge in Australian stock prices in the 12-month and four-year periods before the 1987 crash. The Australian market is currently not in a speculative bubble, with domestic stocks paddling sideways but slightly higher.
US & Australian shares – 1987 vs now
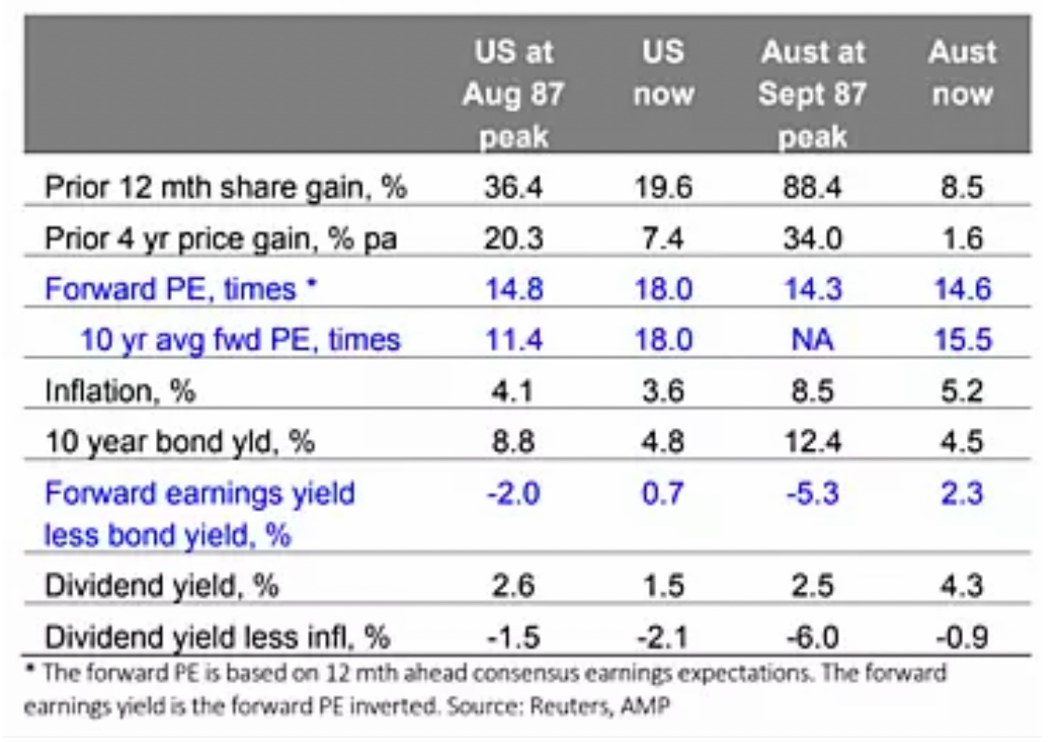
Australian shares might not be particularly cheap, but neither are they particularly expensive. Shares on a relative basis, in the face of rising bond yields, merely became somewhat less attractive.
The earnings yield of a company is the inverse of the PER. Therefore, as bond yields rise, then the market will force earnings yields to rise and PERs fall. If PERs don’t fall in relation to rising bond yields, then shares become less attractive. Investors who are offered higher yields will adjust their allocations within their multi-asset portfolio.
Why macro is a powerful explainer of market movements
In the property valuation example outlined above, we noted the impact on market prices of higher interest rates (or valuations) which can translate quickly through markets. Indeed, as some price reactions happen very quickly (faster on listed markets than on unlisted or private markets) investors need to monitor and adjust both their asset allocation and their return targets. This requirement becomes acute when it is established that bond yields and interest rates have reset at a new higher level.
The outlook for asset returns is where macro analysis comes into play. As I have written in the past, macro is a powerful explainer of why markets have moved sharply in the past and why they are acting now.
If we understand these macro forces, then we have access to some of the important tools required to build forecasts for economic activity, growth, inflation, and interest rates. It is the interplay of all these macro levers that will act to affect the future.
Tailwinds of a higher inflation environment
In past cycles (looking back over 30 years ago) bond yields rose in response to inflation. In the past (unlike the post-COVID period) inflation lifted from already existing elevated levels (3% plus). Central banks responded by aggressive upward adjustments to cash rates that were commonly already positioned at 5%.
Today, we have cash rates set in Australia at 4.35%, with inflation being recorded at below 4%. Cash rates have been rapidly adjusted from 0.1% in early 2022 as near non-existent inflation surged. The chart above shows that “real” cash rate settings are still near historic lows.
Government bond yields have rallied over the last three months, with yields (again) below the yield on the equity market (unadjusted for franking) – after jumping above it in the September quarter of 2023.
What about global markets?
Are low interest rates reflective of a difficult growth outlook for Australia, our trading partners – or the whole world?
The table below represents the recent forecasts from the OECD and they show steady world growth that is dominated by growth for some of our largest trading partners. Both China and India are the standout economies, and these represent the growth tailwind for Australian trade.
GDP projected growth rates for 2023 and 2024
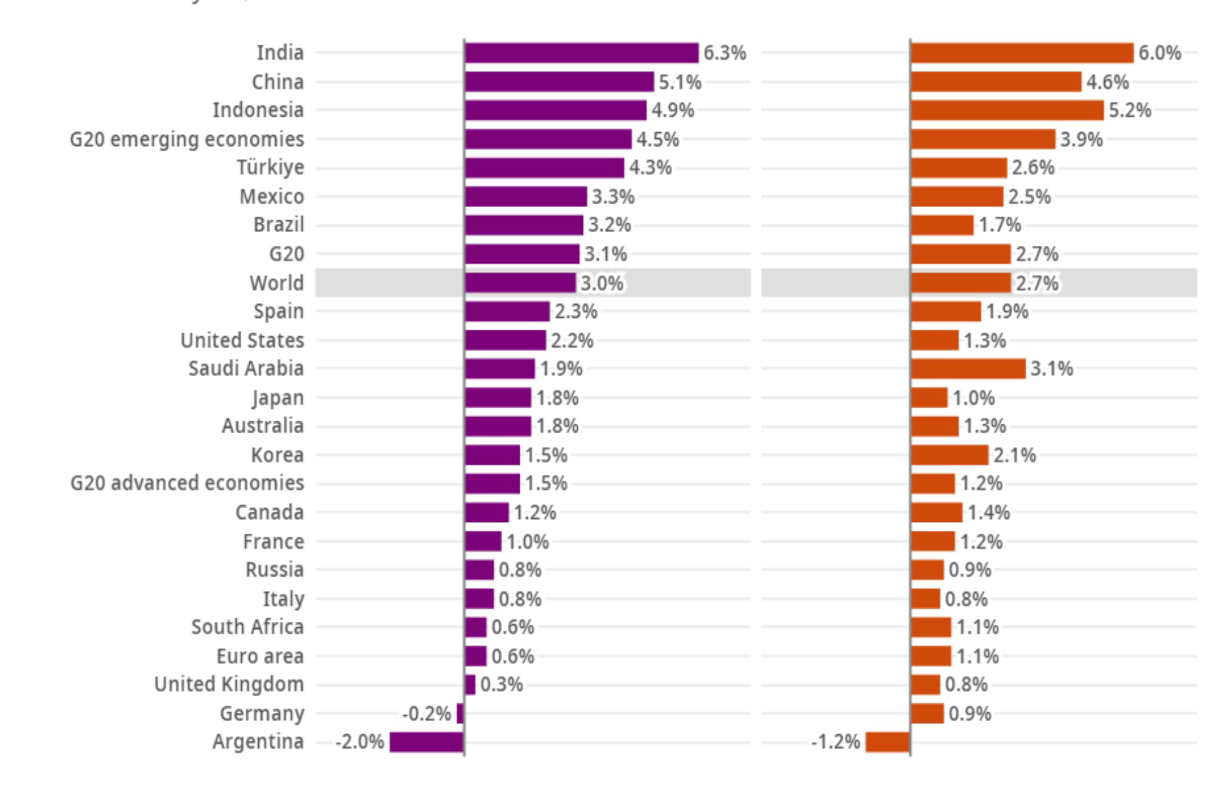
Despite the above, Australia’s forecast growth by our Treasury (and the OECD) is below what should be expected from an economy benefiting from both trade and population growth.
While it seems clear that these two tailwinds will ensure that Australia’s growth will be sustained and then accelerate after 2024, many Western countries will falter from ageing demographics.
Australia’s $3.6 trillion of superannuation savings and low government debt suggest that our growth is assured, even if the Australian government struggles to formulate a credible growth vision.
Economic growth with negligible real interest rates continues to justify investment in growth assets such as equities and property. So, after the reset of market prices caused by rising bond yields, investors’ historic risk asset returns have re-emerged. These long-term returns are captured in the table below.
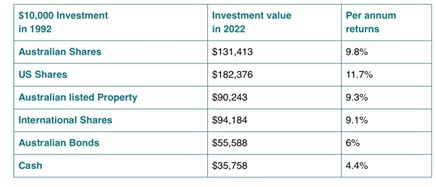
Indeed, despite short-term hiccups, it is clear that long-term returns from growth assets always compensate for the higher volatility.
The US must bring down both the cost and the issuance of debt if it wants to maintain the status of both its currency and its bond market as being safe havens.
The economic adjustments required to reset the US budget situation are not apparent. This suggests the US Federal Reserve will once again need to reintroduce a form of quantitative easing (QE) or curtail quantitative tightening (QT) – even if inflation falls back towards 2%.
US bond yields will need to be managed, to hold down the US government interest bill, just as they have been in Japan for the last few decades.
While a government is not a “household”, the US government debt problem has some similarities to the household debt problem in Australia. Today, Australia has approximately $3 trillion of household debt with the bulk of it borrowed by a third of households. So, as mortgage rates are adjusted upwards, the debt servicing costs for mortgagees are pushed higher, and spare cash flow is lost.
Spare cash flow growth
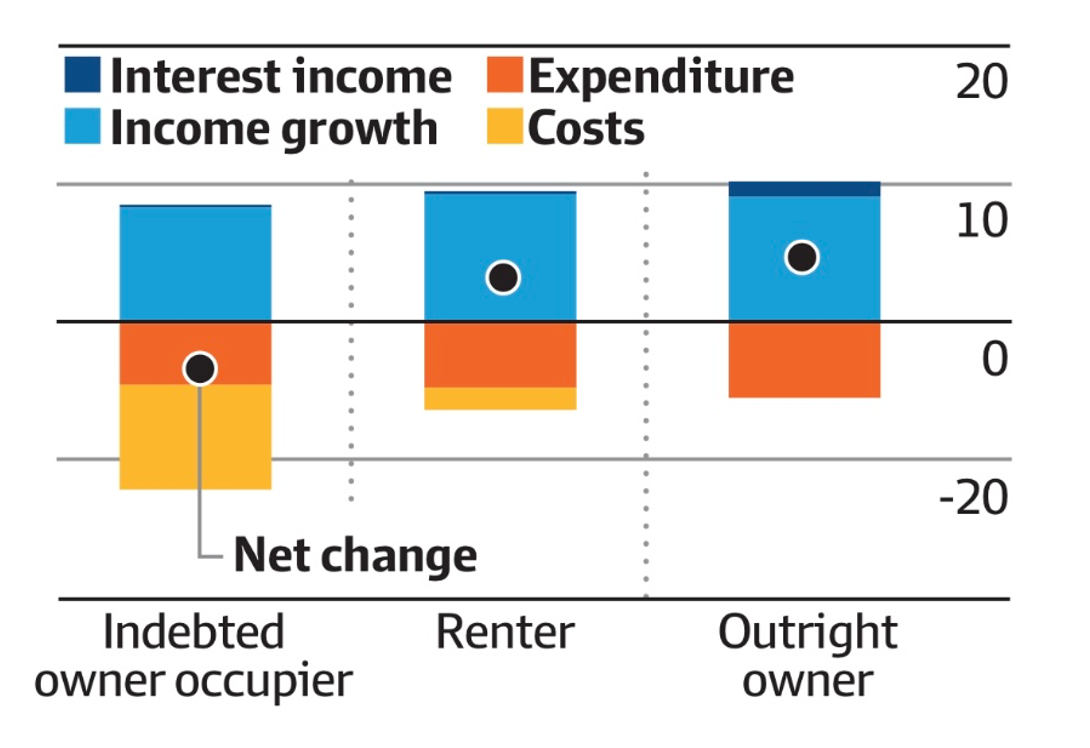
Notably the chart above also shows that higher interest rates act to swell the cash flows of homeowners and particularly well-funded retirees. Therefore, if the RBA is attempting to slow consumption growth and attack inflation through higher interest rates, it will struggle without Government fiscal policy support. Therefore, while today's cash rates are not that high (see above) they are likely to stay at current levels throughout most of 2024.
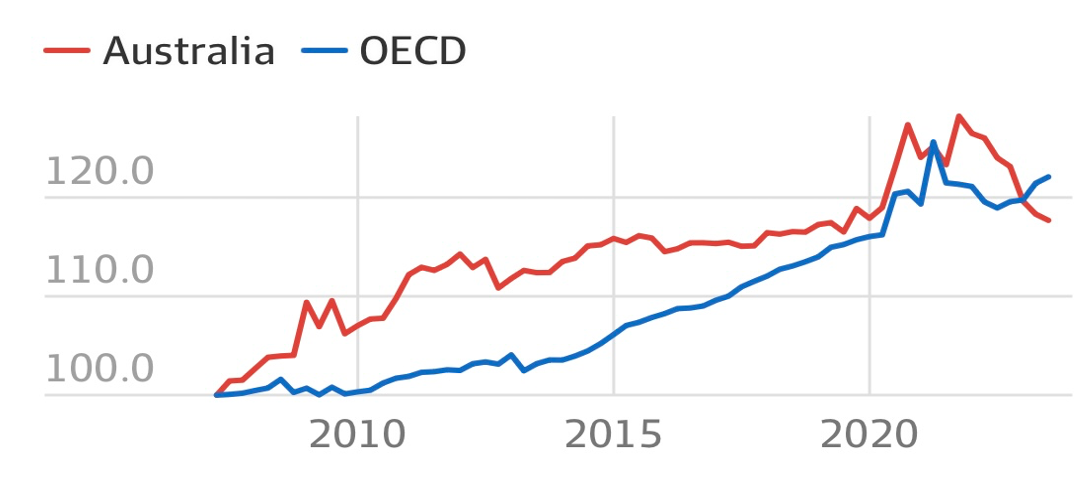
The effect of inflation that is eroding household income for working and indebted households is captured in the final chart. It explains why the Australian economy is in a soft period.
Since the end of the pandemic, Australian workers’ income has not kept pace with inflation and has eroded disposable income for younger families. The cost-of-living pressures have been caused by wages rising less than general inflation. Further, a surge in electricity and petrol prices has also eaten into disposable incomes.
Real gross household disposable income per capita
Why the path ahead favours income assets
- Government bond yields have risen (post-COVID), but they are still below inflation and arguably still not producing adequate returns. However, the rise in yields in corporate debt now offers investors solid income out to three years in duration.
- Property assets have devalued (market values) with higher interest rates and will begin to recover as income grows from rental flows benefiting from inflation. Leveraged property has been hardest hit, but the tailwinds for economic growth suggest property will continue to be a good long-term investment.
- International equities have been highly volatile over 2022 and 2023 as higher bond yields challenged valuations. Australian investors have been protected by a weak currency and should stay alert to the risk of an Australian dollar revaluation in late 2024 that could arise once our cash rates rise clearly above inflation.
- Australian equities continue to generate high, franked income but with limited capital growth opportunities. The equity index remains dominated by resource and financial companies and their performance will continue to dictate the trajectory of equity market returns. Well-funded and profitable small and emerging companies offer the best capital gains opportunity over the balance of 2024.
While 2024 promises to deliver positive returns across all asset classes, the returns from income asset classes have become increasingly attractive. Balanced portfolios should continue to deploy both cash and cash flows to Australian corporate debt paper and target a 6% to 7% return with less volatility and more stability in portfolio values.
If 6% to 7% does not seem adequate, then it is worth reflecting that bond markets have lost about 30% of their value in the two-and-a-half years to mid-2023. Steady returns are far better than volatile returns that detract from the benefits of compounding – which is an investor’s best friend.
2 topics

