Why we still think the Australian economy can pull off a soft landing
We expect better outcomes for fixed income markets in 2025 than in recent times now that the extreme rate tightening is past, yields are still at attractive levels and there is potential for lower cash rates over 2025. Although the outlook appears benign in most cases there is still the potential for greater volatility, particularly with the outcome of the recent US election.
Cloudy with a chance of meatballs
An historic 4-5% increase in the cash rate across most major economies over the span of less than two years has finally served its purpose: inflation is slowing, growth is subdued, and we are seeing some deterioration in the previously robust labour market. While trying to find a balance between controlling inflation and avoiding a recession, major central banks are now starting to ease rates with the Bank of Canada and the European Central Bank beginning their rate cut cycle in June, followed by the Bank of England and Reserve Bank of New Zealand in August and, more recently, the US Federal Reserve delivering a 50bp rate cut to kickstart the US’s easing cycle in September.
The Reserve Bank of Australia (RBA) remains an outlier, suggesting rates are on hold and at times suggesting they may need to be higher. So, what is holding them back?
The RBA believes they still have adequate time to monitor the economy and see inflation fall before needing to cut interest rates. They have focused on stickier core inflation and a strong labour market as a justification for being cautious. The Bank’s forecast in February this year was for unemployment rate to reach 4.3% by end of 2025, however it appears unemployment will remain lower than this currently sitting at 4.1% (refer Chart 1). We believe both metrics may weaken more than the RBA anticipates in early 2025.
The RBA seems to be overly cautious given the labour market has been heavily influenced by government policy and spending, and there are signs that wages are beginning to slow.
Chart 1 – Employment in Australia

Source: Bloomberg, ABS.
Headline inflation has now fallen back into the RBA’s 2-3% target band, however trimmed mean inflation is still sitting at 3.5% (refer Chart 2) and the RBA is forecasting it to only fall within the target band by the end of 2025. Many of the components of inflation that are still elevated are related to services, where prices may only reset once or twice a year and it may well prove that inflation is falling faster than the RBA is forecasting.
Chart 2 – Australian Consumer Price Index (CPI)

Source: Bloomberg, ABS.
Will the RBA cut at all?
We believe the RBA should already be cutting or at the very least should have moved to an easing bias. At present, it’s difficult to know what the exact timing of when rate cuts will come – and their magnitude – given the reluctance of the RBA to move to an explicit easing bias. We continue to hold the view the sooner the better to avoid a potential recession. In Table 1 we map out some possible scenarios on what to expect for the year ahead.
Table 1 – Potential outcomes in 2025

Scenario one: Soft landing
If inflation continues to slow and remains sustainably within the RBA’s target band, and the labour market remains tight and without a significant increase in the unemployment rate, the RBA will likely cut interest rates slowly to bring monetary policy settings back to neutral. The RBA’s focus is to maintain its “dual mandate” of keeping price stability and full employment, and we think that could mean between 1-5 rate cuts of 25bps each. If the economy returns to slow and stable growth, then we believe the RBA would have achieved its “narrow path” of bringing inflation down to target without “killing” growth.
The Australian economy was unexpectedly resilient over this rate hike cycle, preserving gains in the labour market and sustained positive GDP growth despite the RBA holding interest rates at 10-year highs for over 12 months and with no guidance as to if and when cuts might come.
Chart 3 – Domestic final demand growth* (year ended with contributions)

Source: ABS; RBA.
Much of the strength in the economy has been due to public demand (i.e. government) offsetting and exceeding the decline in private demand (refer Chart 3). We expect support from the public sector will continue at similar levels, in particular the cost-of-living adjustments to help bring inflation down, labour market support from government initiatives such as NDIS and aged care as well as government investment in infrastructure. However, if public demand were to slow and private demand not pick up the risk of a harder landing increases (see scenario two).
If the scenario plays out, we will see a shallow rate cut cycle from the RBA in 2025. This is likely to see the Australian economy continue on a decent growth path, with a rise in household disposable income and increased consumer and business consumption (refer Chart 4).
Chart 4 – Household consumption and income

Source: ABS; RBA.
Rate hikes have made lives difficult for those with debt, however the increase in mortgage arrears has been less severe than expected. Savings buffers that built up over the period of ultra-low interest rates, higher workforce participation and increases in income have helped cushion the cycle. The strength in house prices has provided additional confidence to mortgage holders which has reduced forced selling and losses. Traditionally in a rate-rising environment, property prices would be under pressure as there would be an increase in sales from mortgagees no longer able to afford to mortgage repayments. Property prices have remained elevated due to increased immigration and a shortage of housing supply.
For the fixed income market, investors could expect to see higher income and benign economic conditions that are supportive to businesses, with beneficial credit conditions which should see credit markets perform well. We should also see a small steepening of the yield curve as cash rates move lower which in turn should see longer maturity bonds become attractive to local and offshore investors as the rate cutting cycle nears its end towards the back end of 2025.
Scenario two: Deep recession
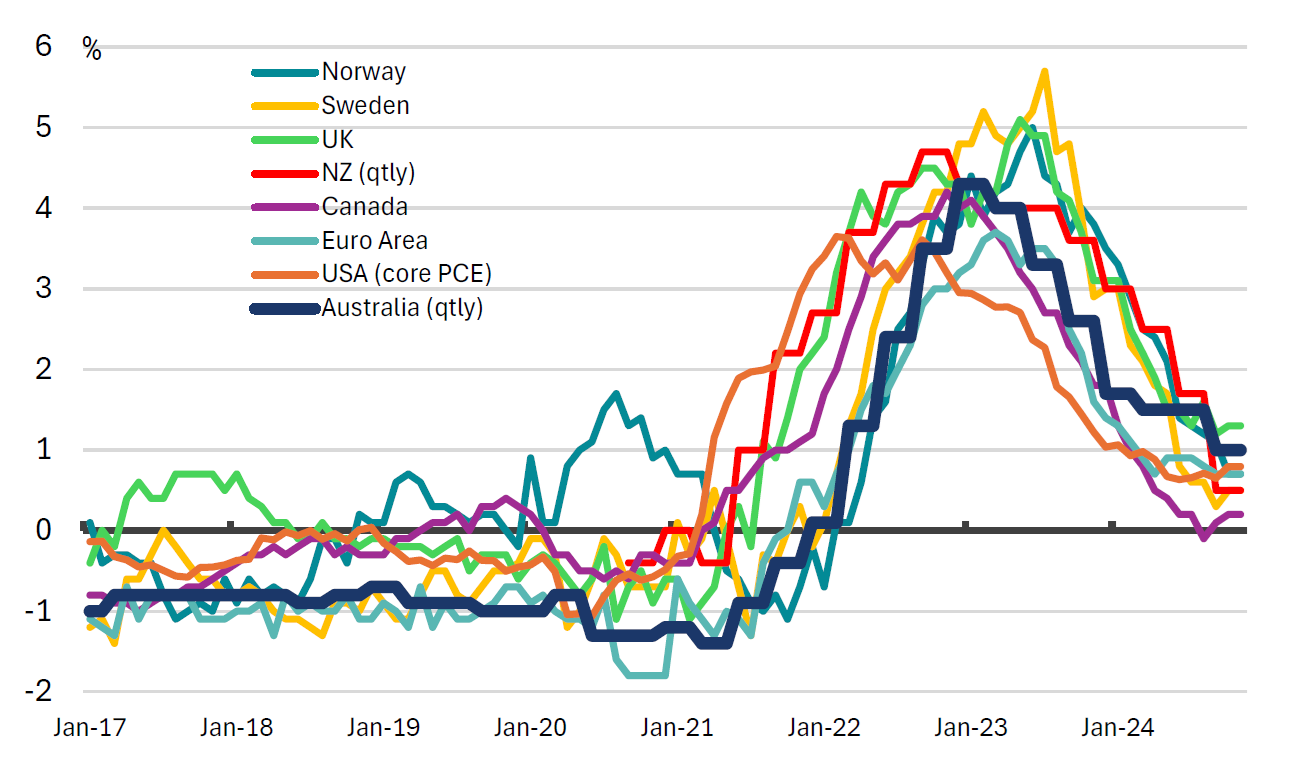
As mentioned above, central banks globally began to cut interest rates as inflation pressures eased, while the RBA has remained reluctant to do so. As seen in Chart 5, Australia is not that different to the rest of the world with its inflation growth falling in line with western peers. If the RBA keeps interest rates at current restrictive levels for too long, inflation could fall to lower than the target band and compress consumer spending even further. This can potentially cause the economy to fall into a deep recession. In this scenario the RBA would need to deliver deeper and faster rate cuts, which we think is in the range of 150-250bps.
Chart 5 – Underlying inflation less inflation targets

Source: YarraCM.
The economy could also be at risk of falling into a deep recession if public demand falls and governments reduce spending, which has been one of the major contributors to growth and employment. Chart 6 below shows the sectors most influenced by government spending, with the Healthcare and Social Assistance sector contributing the most to employment growth and tight labour conditions. The National Disability Insurance Scheme (NDIS) and aged care support are particularly large contributors, bringing female workers back into the workforce and boosting workplace participation.
Chart 6 – Employed persons in industries connected with public sector spending

Source: ABS.
Public demand now makes up a significant portion of the Australian economy, and it is estimated to reach almost 30% of GDP by 2028 (refer Chart 7). What happens to the economy if the governments pull back on spending due to increasing budget deficits? Unless the private sector begins to increase spending and investment, the economy will contract.
Chart 7 – New public demand to reach 28% of GDP

Source: Westpac.
One key development to watch for is what happens in China. As Australia’s largest trading partner, making up of almost a quarter of all exports and imports, China’s economy has already experienced a rapid slowdown following a downturn in the property market, and this is despite various government stimulus packages. It remains to be seen if this will be successful or if the Chinese government will continue to add stimulus to the economy.
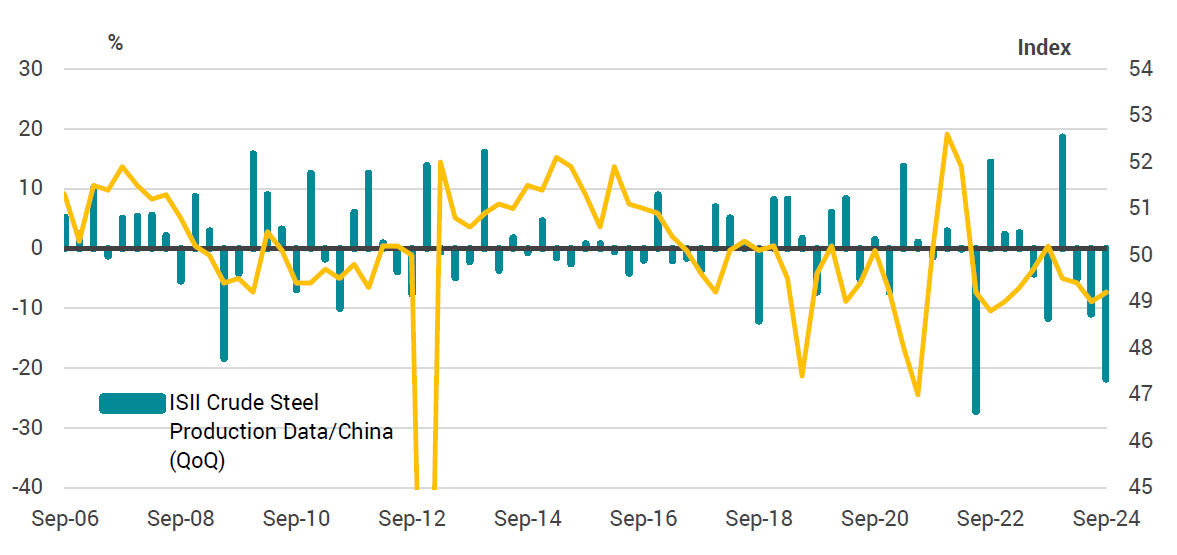
There are additional risks to the eastern giant’s economy, with the incoming Trump administration set to place heavy tariffs on Chinese goods and restrict access to certain technology. Additionally, infrastructure investment in China has been moderating, with steel production declining as a result of their economic slowdown (refer Chart 8). This has direct impacts on Australia, which supplies most of China’s iron ore.
Chart 8 – China manufacturing PMI and Steel Production

Source: YarraCM
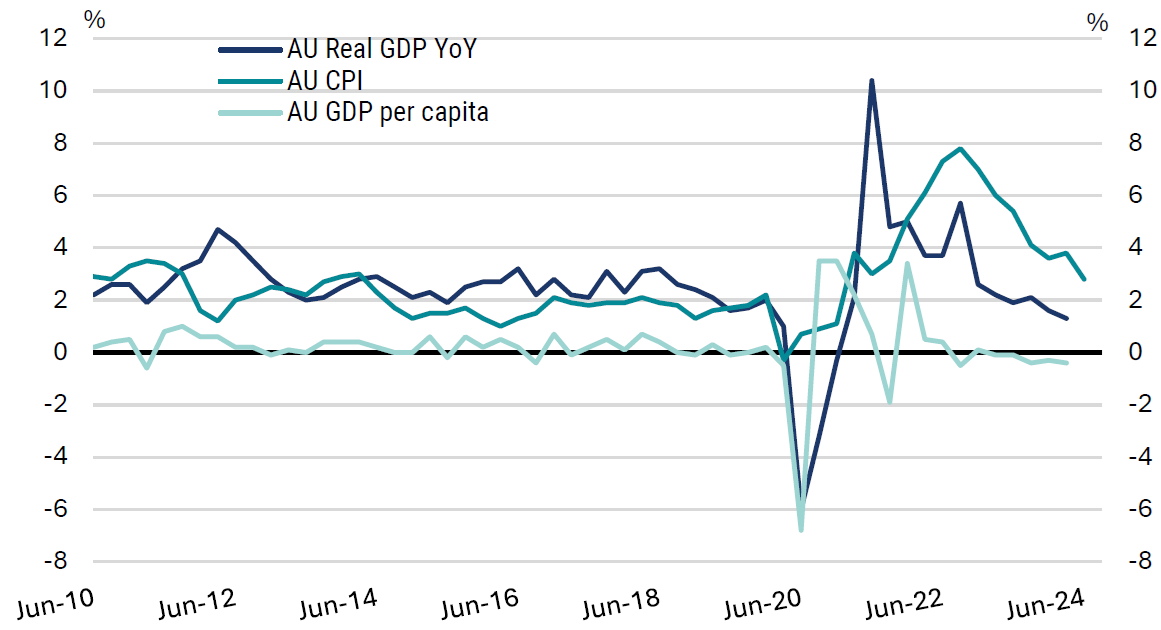
Another area of concern is the bi-partisan consensus that Australia needs to reduce the inflow of migrants. Australia has now been in a per capita recession for six quarters, and headline GDP growth is only in slight positive territory due to the increases we’ve had in population (refer Chart 9). If you reduce population, the per-capita recession becomes an actual recession unless something improves growth for the existing population. Moving from a per-capita recession to an aggregate recession may have broader impacts on confidence, which in turn impacts consumer and business spending and investment.
Chart 9 – GDP and Inflation

Source: Bloomberg, ABS
For fixed income markets, a hard landing would see riskier assets underperform, including credit and other non-government bonds. Income would be reduced as interest rates fall but investors already allocated to fixed income would benefit from the capital gains. We should also see yield curves steepen significantly under this scenario which is typically good for longer term active returns in fixed income since it increases the opportunities for managers to outperform the market.
Scenario three: Geopolitical uncertainty
2024 has been an eventful year in the geopolitical space, and there’s likely to be further uncertainties as we head into 2025. We see risks around the world in both the potential for new conflicts as well as escalations in existing wars that can cause significant social and political impacts, and trigger potentially significant economic consequences from supply chain disruptions (inflationary), falling demand (weaker for growth). And not to forget the profound social consequences.
There is also a widespread belief that the US under Trump, and the Republicans’ influence more broadly, will be positive for growth and inflationary for the global economy. While it’s true that any tariffs the Trump administration imposes will likely have an inflationary effect on the US, raising the cost of imported goods, it is also likely to lower growth globally as major exporters to the US look to diversify trade to other countries. That is potentially deflationary in countries other than the US.
It is possible we could see retaliations against the US from countries impacted by these policies, which could range from trade wars to physical confrontation. Hopefully cooler heads prevail but we expect the next 12-18 months to be considerably volatile.
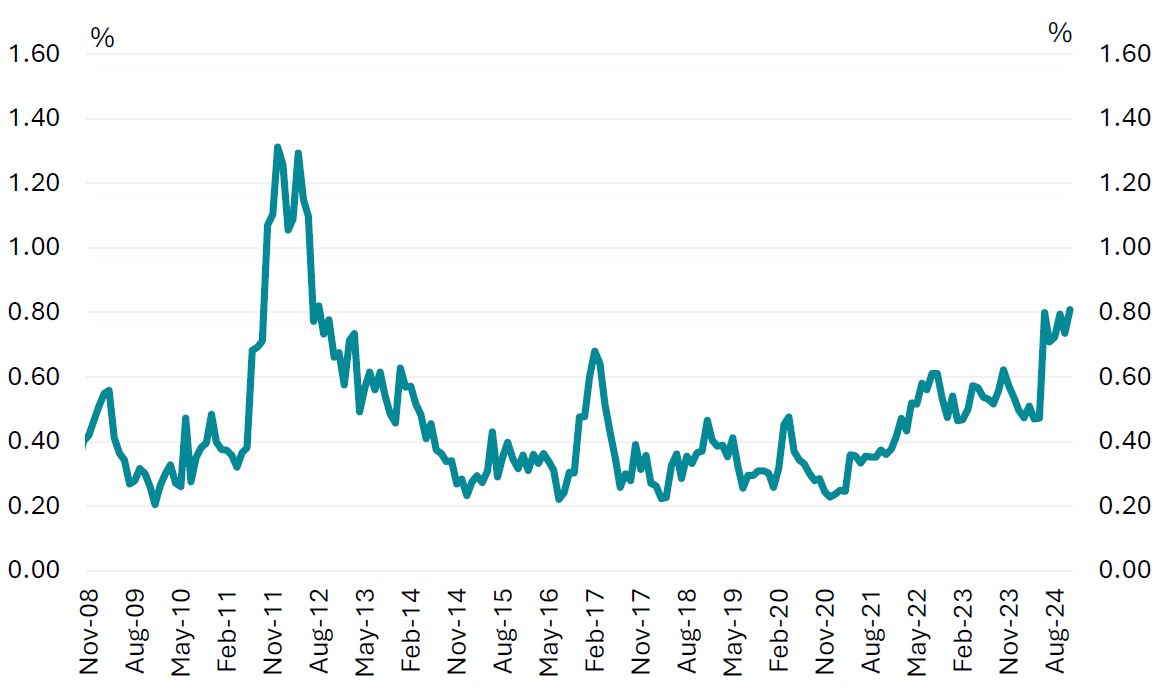
One final consideration is that Fiscal deficits globally have remained high, with virtually no appetite from incumbent governments or opposition parties to address the ever-ballooning size of government debt in most western countries. As we have seen in recent years with the UK (the extreme move in long government rates due to Liz Truss’s Governments economic agenda) and currently in France (with French bond spreads to German bonds widening back to levels not seen since the European crisis in 2012) (refer Chart 10), the risk of a significant event in government markets (often referenced to so-called “Bond Vigilantes”) has risen.
Chart 10 – France 10yr vs Germany 10Yr Bond Yield Spread

Source: YarraCM
Populist government policies which assume debt at a reasonable cost is in unlimited supply may test the patience of bond investors over the next few years. Although the risks are currently greatest in Japan and Europe given their dire demographics and growth profiles, the US is probably the country at most risk if the incoming administration tests markets too far, particularly given the US’s reliance on global funding for its bond market. The US’s status as the world’s reserve currency provides it a large degree of protection that other countries do not have, however given its likely antagonistic approach to China (one of the largest holders of US government debt), the risk of a US bond meltdown during the next few years is heightened. Although this will have implications for all bond markets, Australia is likely to be a safe haven for investors given its lower debt and stable government.

1 fund mentioned

