Will the copper rally hold?
There is an old market saying that I swear by.
The cure for lower (higher) prices is lower (higher) prices.
Like many broker sayings, it has a whiff of Yogi Berra about it.
Why are prices up? More buyers than sellers.
Market watchers talk in riddles because they speak to what makes a market.
Markets work as economic regulators because they ration commodities by price.
Price is the thing that regulates supply and demand.
Of course, this is true if you live in a market economy.
Have you seen any lately?
Just kidding...
What we do know is that a large slab of public officialdom, and a very big chunk of financial market practitioners, don't place much faith in market signals.
They mostly ignore them.
This is why we have legions of investment banking analysts building complicated supply and demand models to forecast commodity prices based on projects.
These people do not understand that mine project progress is determined by price. Using the project pipeline to forecast prices is what idiots do in investment banks.
I should know, because I used to be one.
Now, I don't bother with any of that nonsense. I have this one personal rule.
Don't forecast commodity prices because that is the tail on the dog.
In my experience, the superior approach in financial markets is twofold.
- Study the history and pace of jurisdictions in bringing on new supply.
- Study the character of price moves to determine the health of the commodity dog.
If prices are low, and spiking lower, then the dog is sick, and the tail won't be wagging.
If prices are high, and spiking higher, then the dog is chipper, ready to chase cars, savage the local postman, dispatch your shoes, give the cat a neurosis, and wag its tail with pride.
The commodity dog is like that, and no investment bank analyst has yet figured it out.
Of course, my favorite commodity dog is the Red Dog, namely copper.
It's a dog in the bad times and a dog in the good times.
You can always rely on the Red Dog to lead your way.
The dirty little secret about monetary inflation
Over the years, I have done a lot of research in commodity markets using data spanning over a hundred years, or more. You probably don't recall, but there was a Great Donkey Inflation, back in the day, in Roman Egypt. Donkeys got expensive because a foolish emperor cut the coin.
Foolish emperors are back in vogue now, and they have been cutting the coin like crazy. Conventional wisdom says inflation is licked. Well, let's wait see...
You are not supposed to say such things, if you work in an investment bank, because that is a job where you are paid to talk about what people want to happen.
The creation and dissemination of popular fantasy is not the key skill required to be a successful investor. If you like that stuff, then get a job in advertising.
Investors need to have a clue about what will likely happen, whether they like it or not.
This is not the kind of advice you will get from an investment bank.
It simply is not their job.
The happiest day of my life was when I got paid to stop working for an investment bank.
Enough of the cheap shots, let us now look at something very interesting.
We are going to take a look at the history of nominal and real gold bullion prices in USD, and then again in AUD. You don't see these charts much. Who knows why?
However, first a little history. The US dollar used to be pegged to gold.
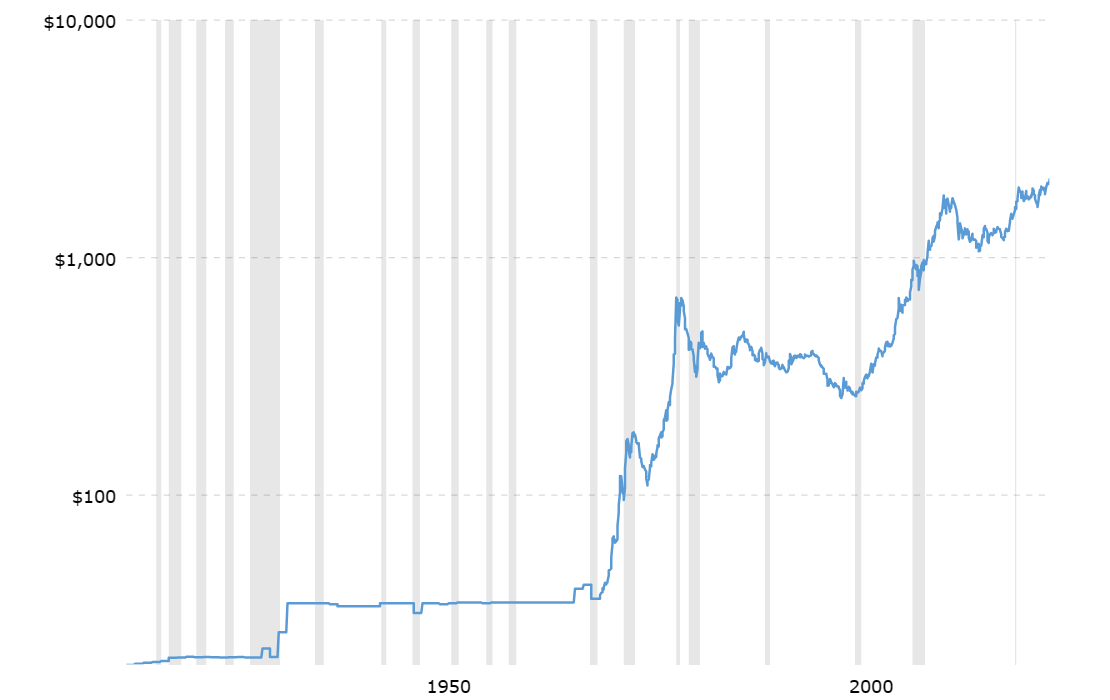
Everyone reading this doubtless knows that the US Dollar used to be exchangeable for gold at a statutory exchange rate. This was about $20.72/USD per Troy Ounce in the early years of the previous century. Then the Great Depression came along, and President Franklin D. Roosevelt reset the rate, over some years, between 1932 and 1934, at $35/USD per Troy Ounce.
This process included the outlawing of private ownership of gold.
Roosevelt sanctioned a commodity inflation to free up the logjam in private credit.
In the process, he also caused a relative deflation in the price of silver, which set off wars in Mexico, inflation in China, which was then on a sliver monetary standard, and sundry other forms of collateral damage to the global price system.
It was not all terrible as this got the USA out of the depression era credit squeeze.
The wars in Mexico also shut down many viable narrow vein underground silver mines. This is why that nation remains prospective for rich silver deposits mineable with modern equipment, rather than the picks, shovels, and dynamite of the 1920s.
People in China were unhappy about the destruction of their monetary system, which gave the then nascent Communist Party of China help on the membership drive.
The history of Life on Earth is like that. Mess with money, and stuff happens.
These days we are supposed to believe that nothing bad can ever happen by systematically messing with the price of money.
In our time, we call this "good economic management". Don't get me wrong. There is merit in monetary policy, but not as a crutch for no policy.
Here is the same nominal USD chart since 1968 when the gold market became tradeable.
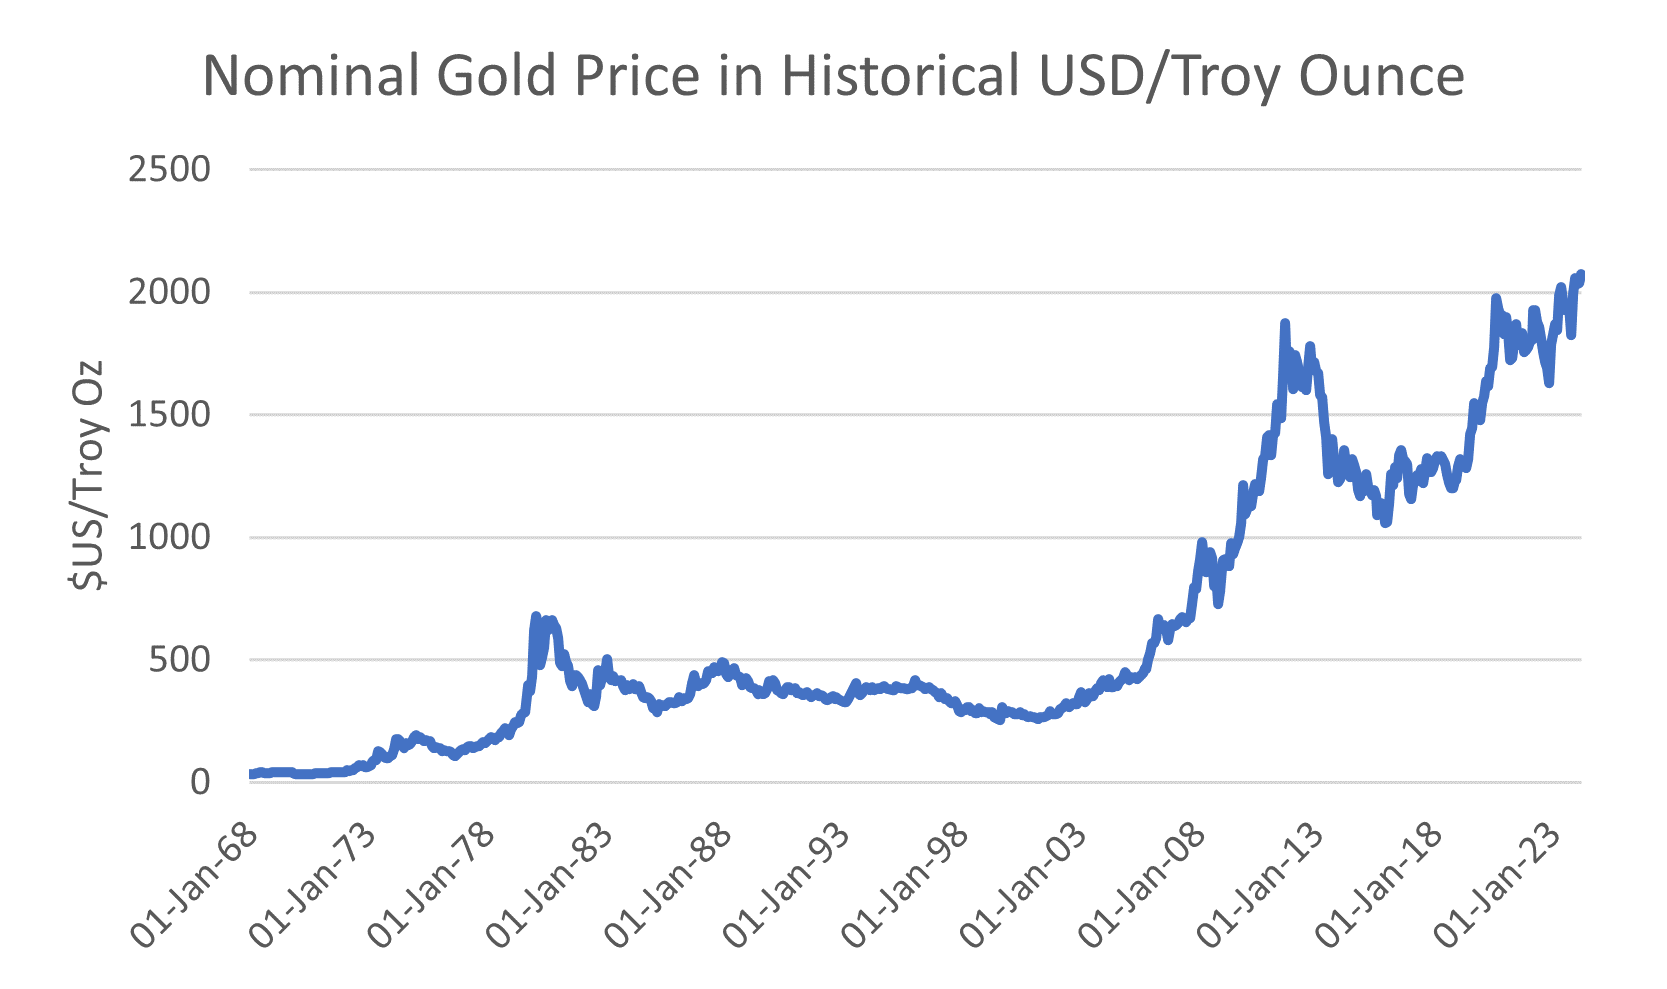
Seen that one, so let us restate that in USD adjusted for inflation via the US CPI.
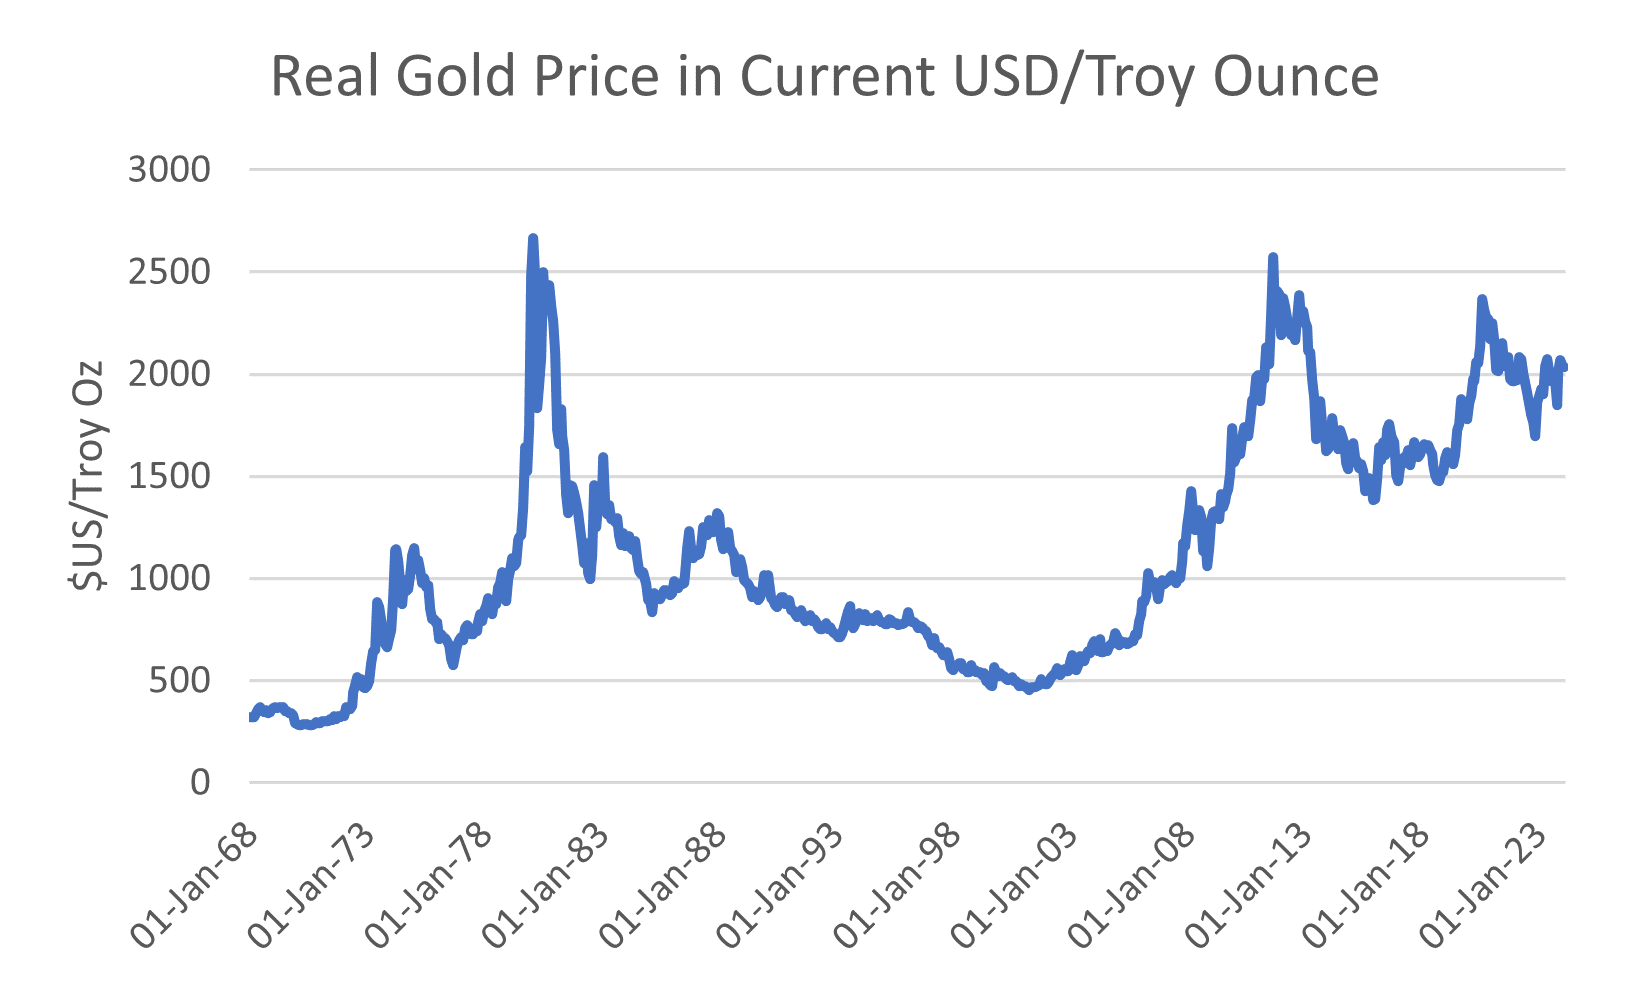
Notice that we now have something resembling a cycle in the period of post-Bretton Woods fiat money, based on a global US Dollar standard. The big spikes in the 1970s were linked to the Middle East Wars in Israel, and the OPEC embargo of US oil that followed.
Eventually, the Saudi deal to price oil in USD, plus the Volcker era of tighter credit got both the real and the nominal gold price down. Inflation, of the commodity kind, did not really begin again until the Greenspan Federal Reserve instituted the Fed put on markets.
This combined with the supply shock from China cheapened world manufactured goods prices, but at the expense of higher commodity demand to make them.
If you only looked at things in USD, this would be a simple story.
Gold is too high in real terms, and so it should fall.
However, profit margins for gold producers are not real high at this time.
Perhaps we should not behave like Goldman Sachs in New York, and only price in USD.
Let's look at gold in the Aussie peso.
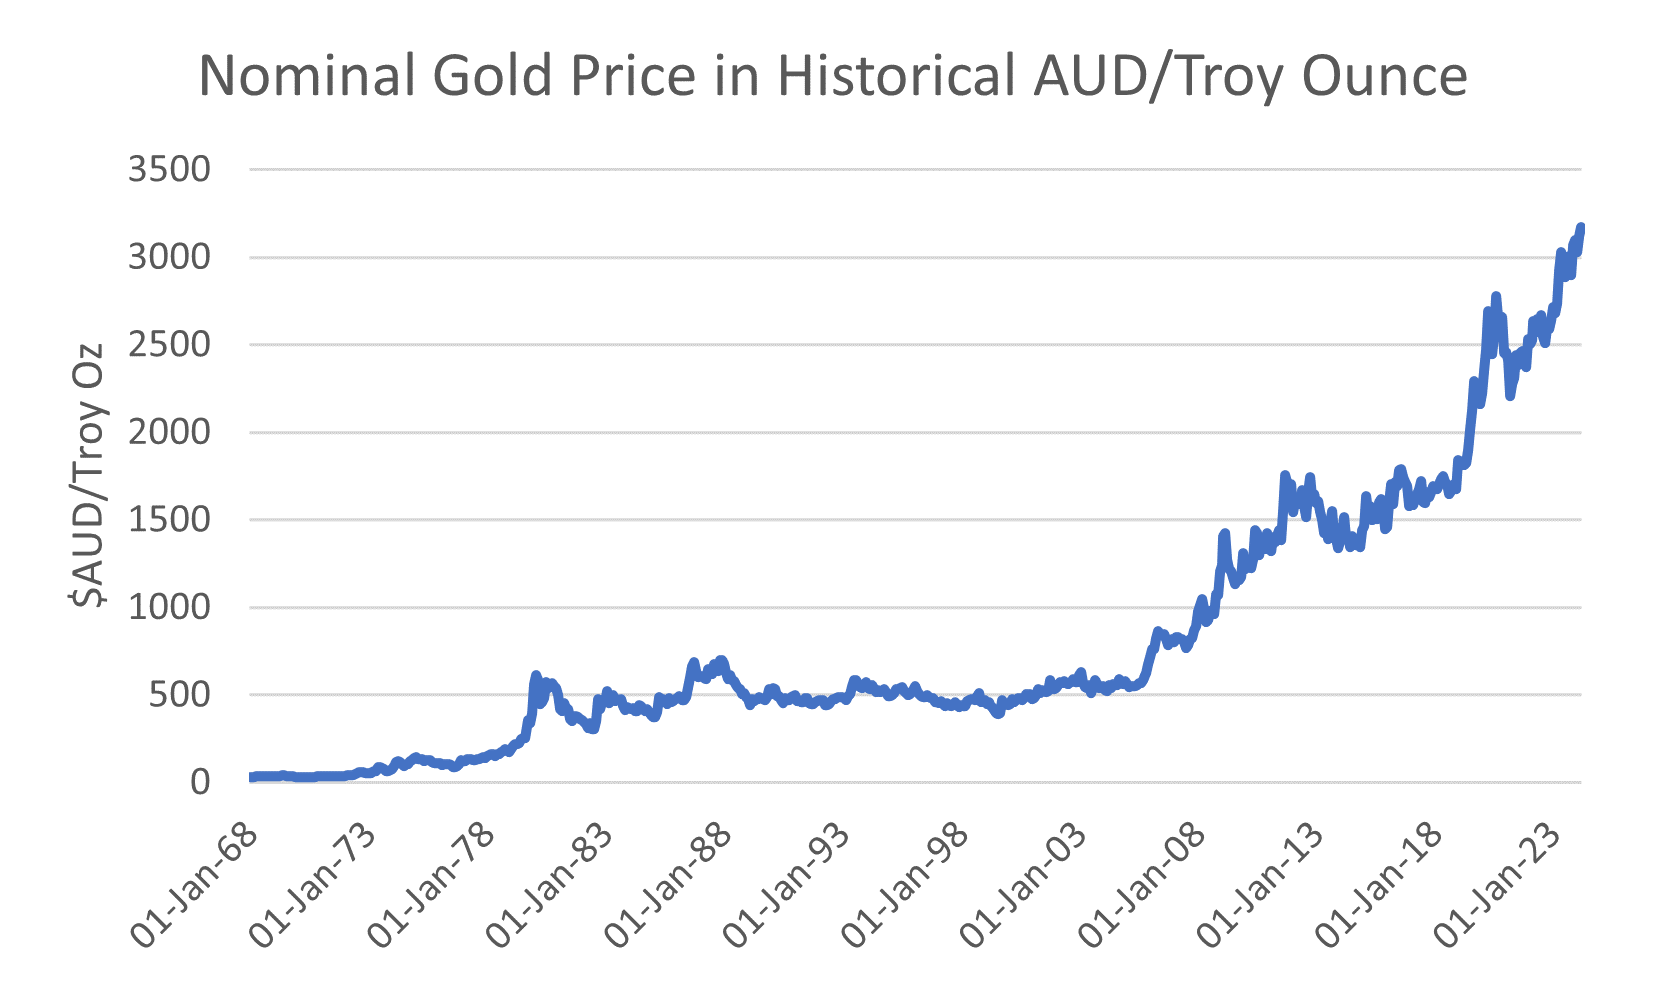
The Reserve Bank of Australia (RBA) does not typically show the data in this form.
If they did, folks might ask a few searching questions about monetary policy.
Out of fairness, let us look at the nominal data deflated by the Australian CPI.
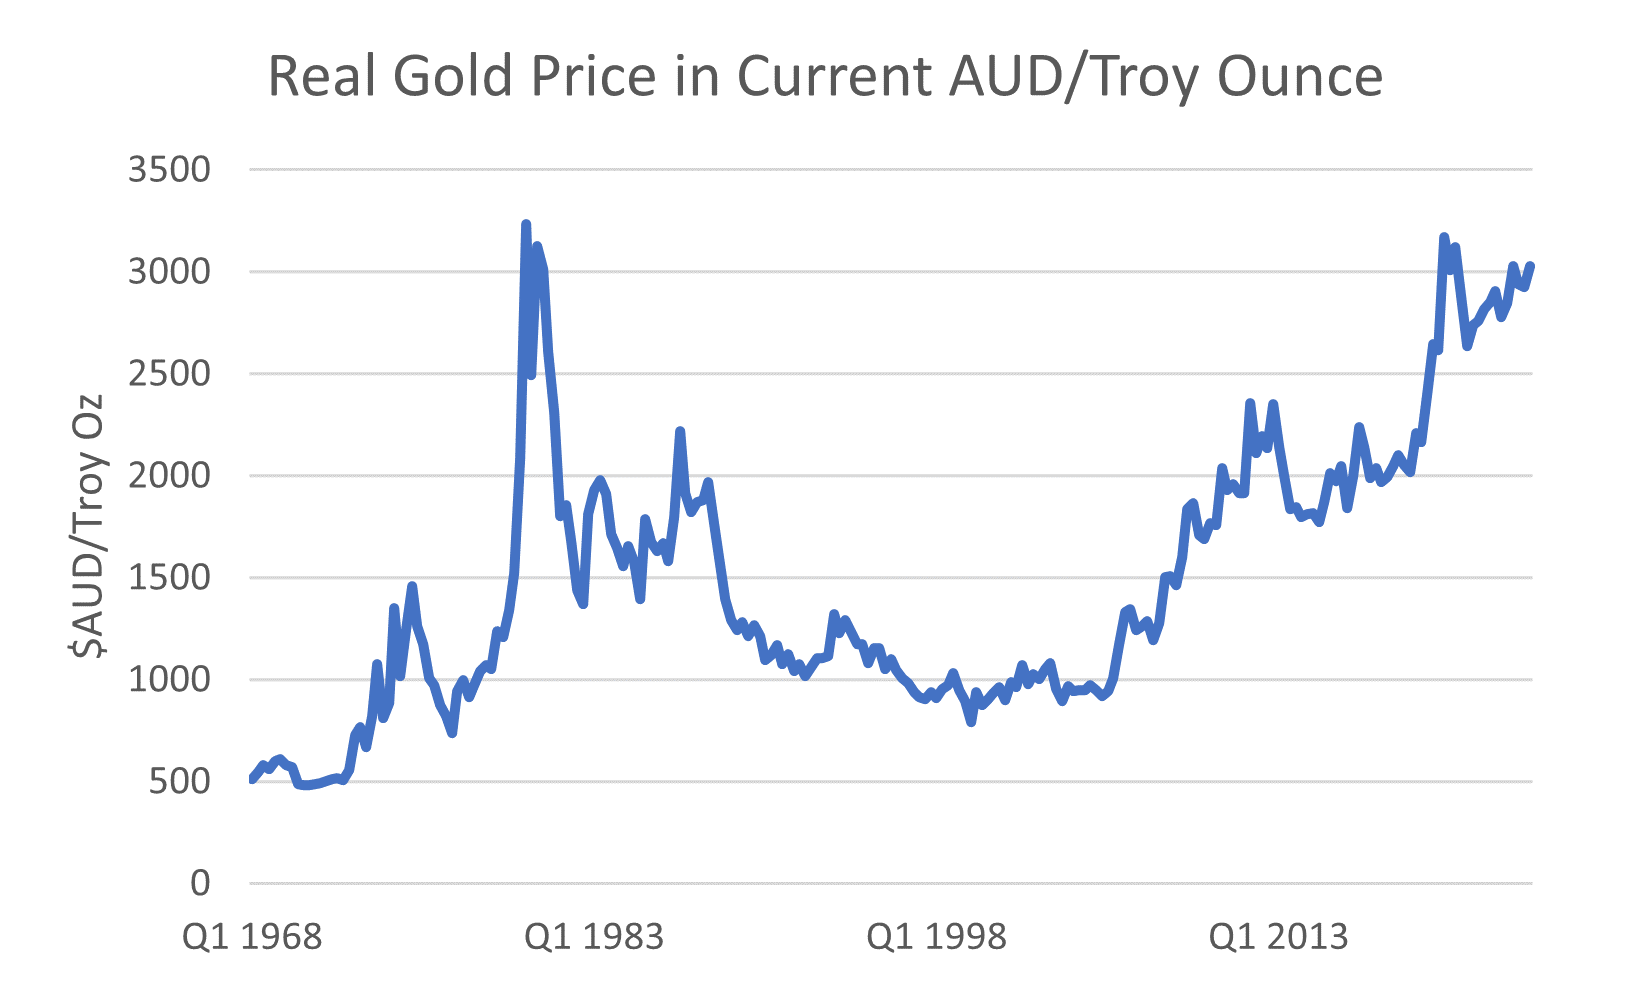
Once again, should not gold prices fall because they are too high in real terms?
That is a fair question but look again at the AUD nominal chart.
Through much of the highest inflationary period from 1975 to 2005 the nominal price of Australian gold oscillated around $500 AUD Oz. Then it took off in 2005.
Huh?
Is not gold supposed to be an inflation hedge?
During a good slab of the high inflation period gold was steady.
During the post-inflation period from the early 2000's it went Moonshot at an 8% nominal rate of return. In real terms it is up around 3 times in 20 years.
That is 6% CAGR real!
Throughout this period the RBA was crowing about their successful control of consumer price inflation through monetary policy. However, the reason consumer goods were not going up much in price had nothing to do with the RBA.
It was down to cheap goods from China.
What did go up at a rapid rate in Australia was house prices.
Gold appreciated at 6% real and undeveloped land by about the same margin.
These days it is hard to find an economist who is not paid to tell a story. If you find one, they might be able to explain what was going on during this period.
The good deflation of cheaper prices for goods from China was turned into a good inflation for house prices, and pricing power for anybody selling the cheaper goods from China, who could then offer them at steadily rising prices. When you run an economy in this way, there is little or no incentive for investments in productivity enhancing equipment and processes.
The result is that productivity collapses, for most industries.
However, what of Dr Copper?
Remember the Red Dog of commodities has a PhD in Economics, right?
Surely, surely, surely, Dr Copper could see straight through all of this, no?
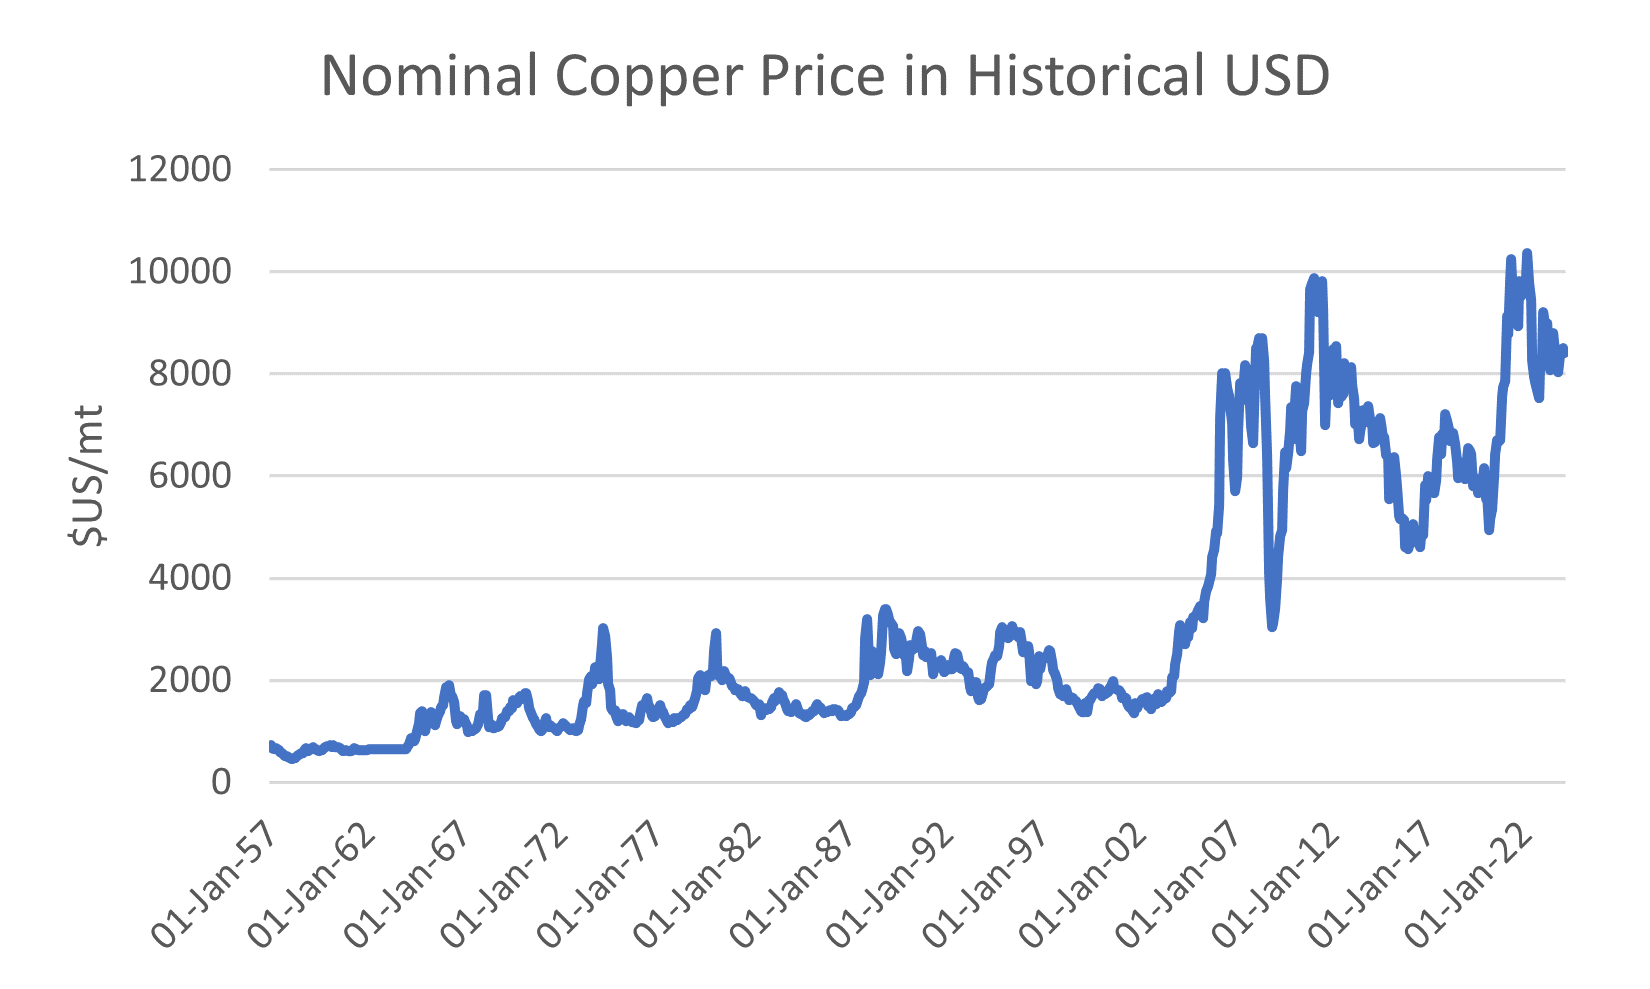
Note that this chart is quite different than gold. The 1970s inflation in copper disappears when compared with the post-2000 lift in copper prices once China entered the WTO.
How are we travelling now in real terms?
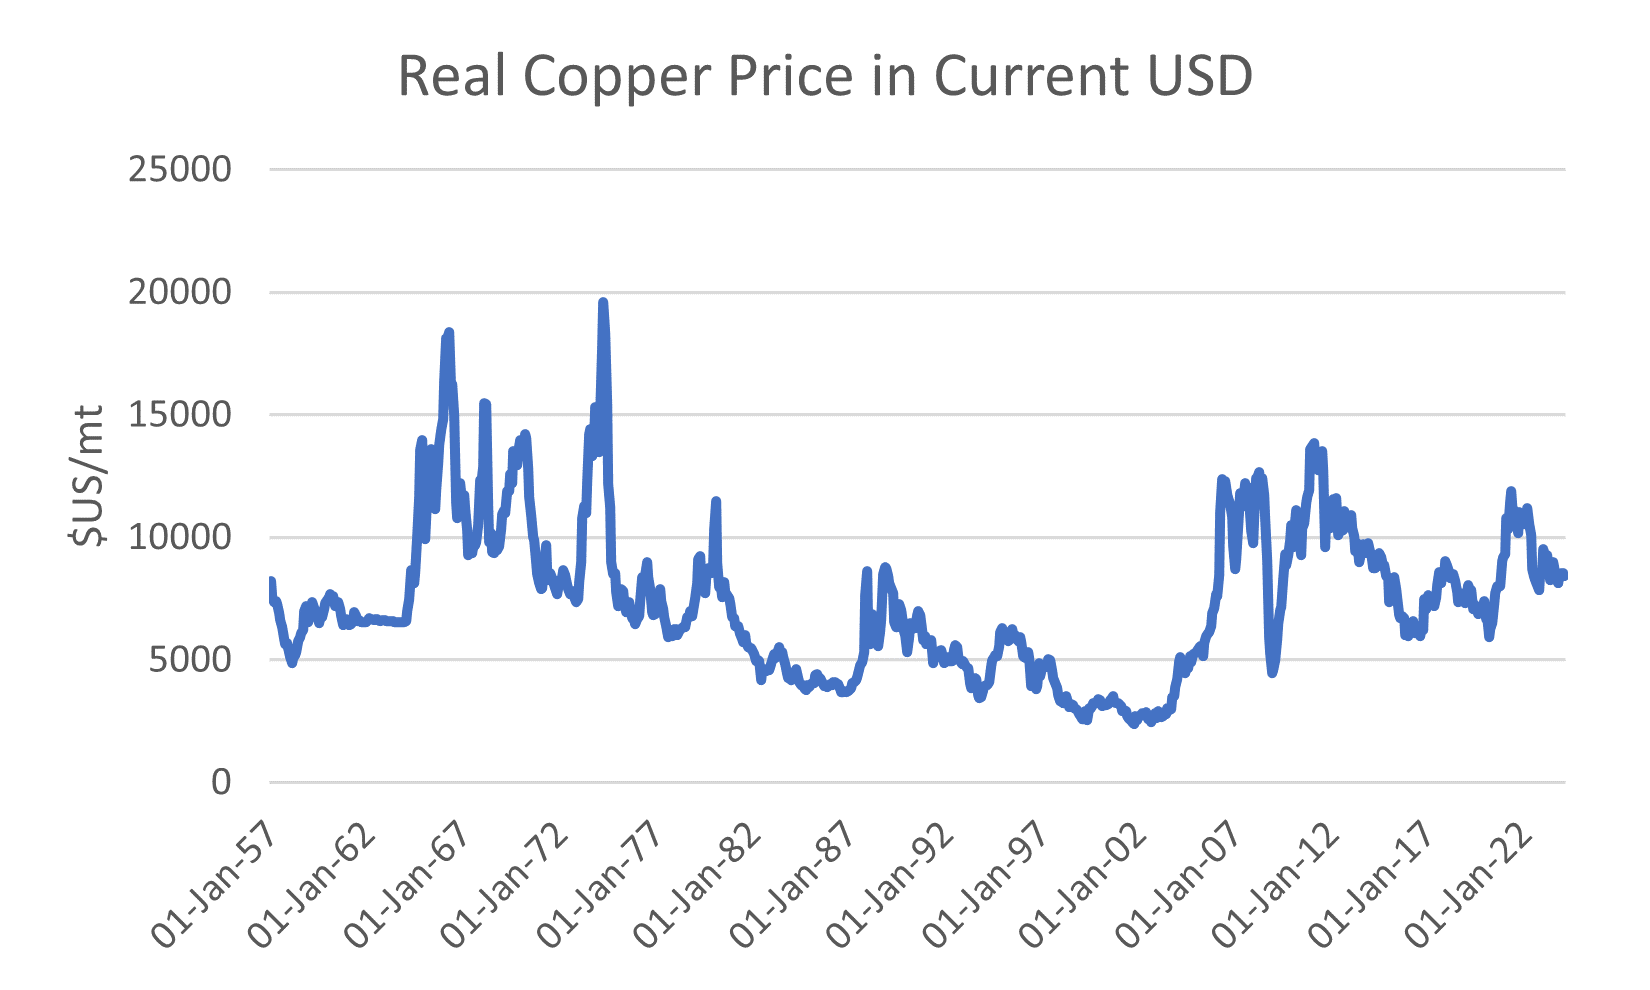
Dr Copper was clearly not fooled by any of this monetary nonsense.
In real terms, copper is just about the same price as it was back in the 1960s.
What is interesting is just how low the real copper price got back before China came online. Arguably, copper was in a depression in the late 1990s.
Indeed, this is the time when the USA had to restructure their copper industry due to low profits and struggling mines.
Onwards to the recent history of copper production!
We really need to understand how the copper industry has changed since 2000.
A short recent history of global copper production
Obviously, China has a lot to do with the pricing dynamics of commodities. However, for most of the past hundred years it has been the USA that dominated commodity demand. For good data, collected consistently over many years, the US Geological Survey has no peer.
I use the annual USGS Mineral Commodity Summaries for all such background studies.
For starters, let us get oriented with the market structure today.
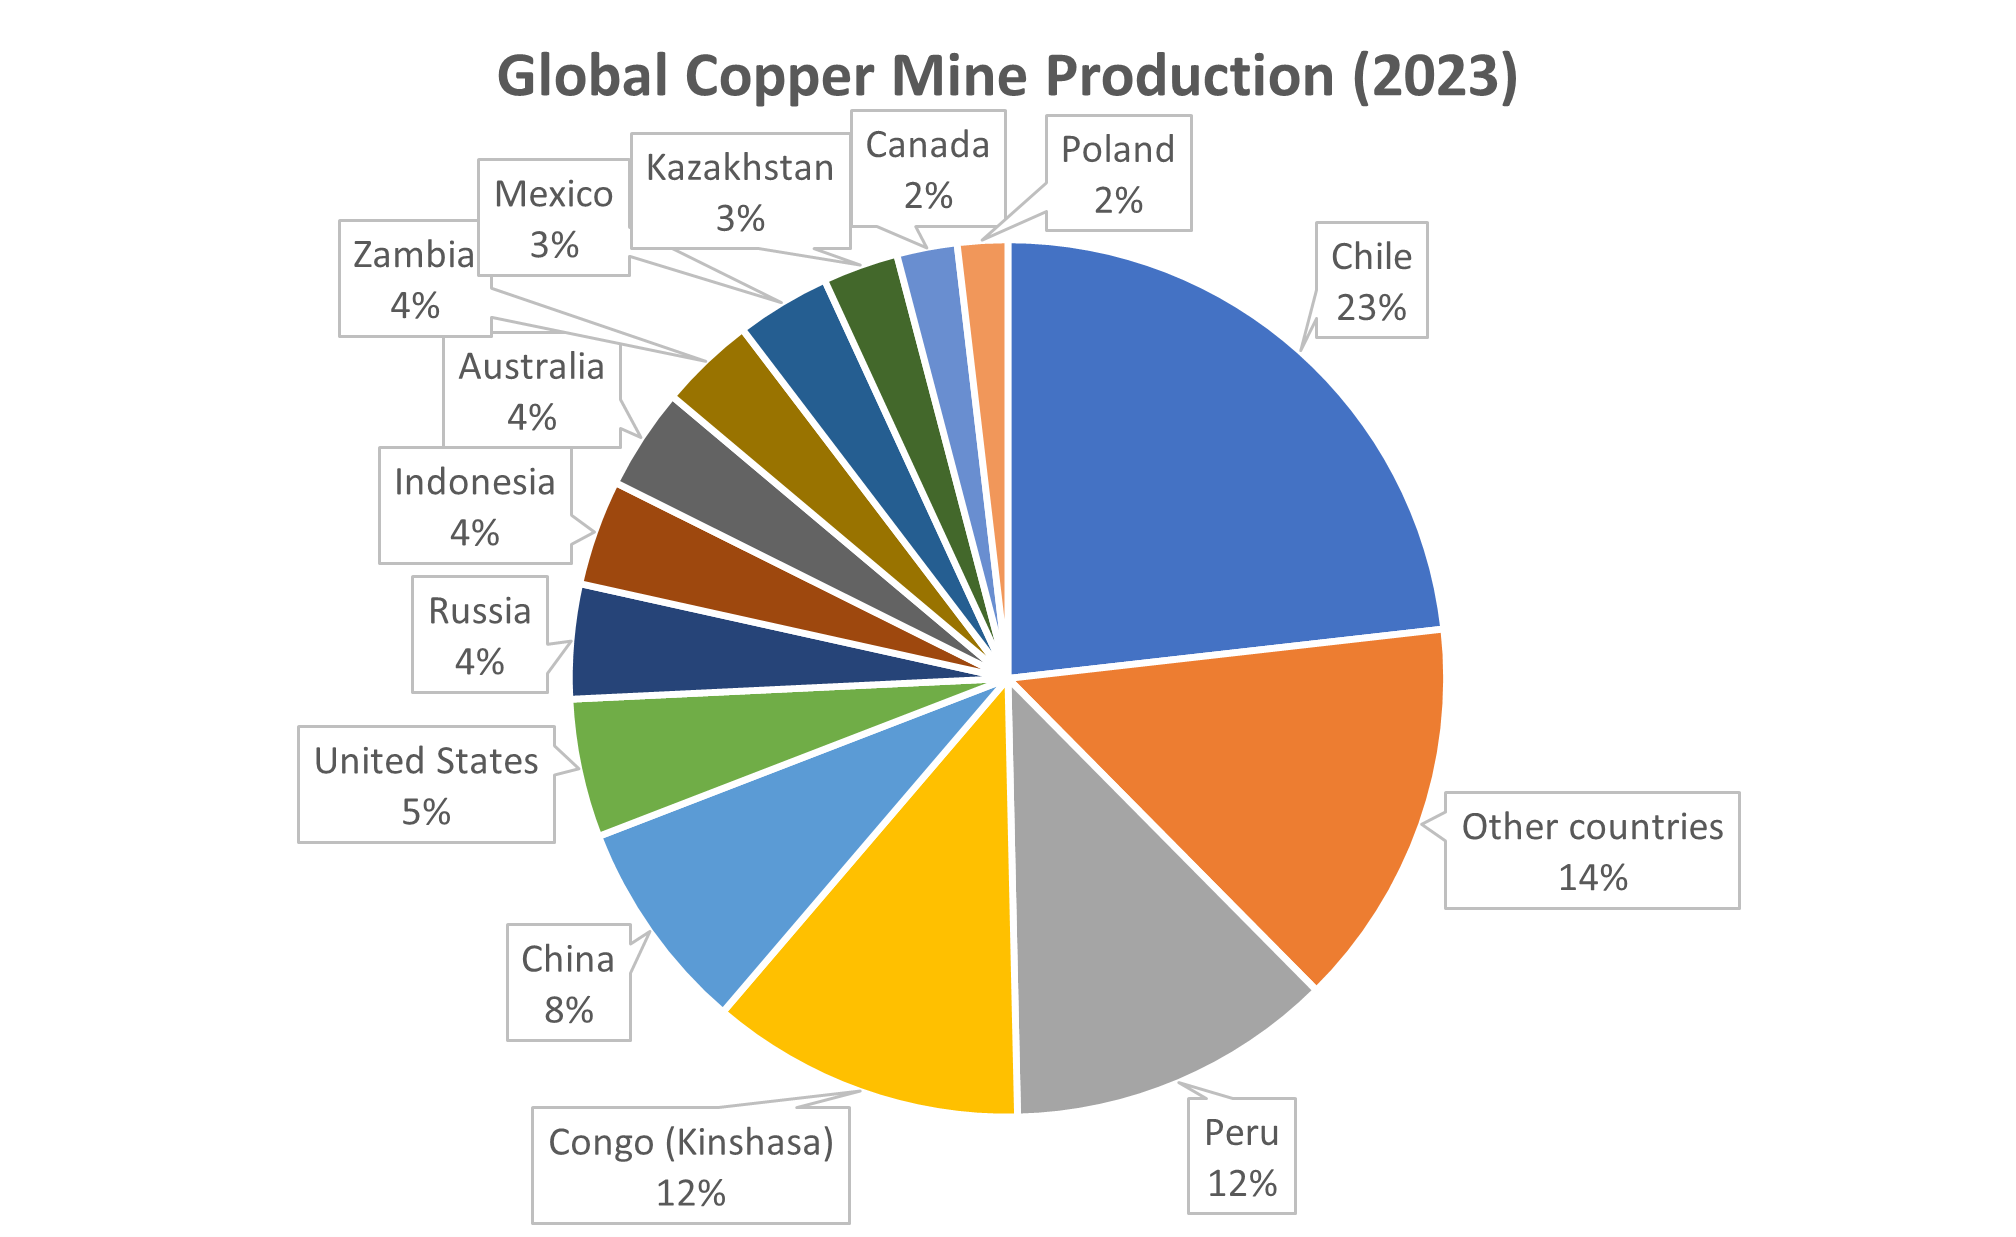
Some mines produce a refined copper metal, but many produce concentrate that is then sent to the smelter/refinery for conversion to pure metal. This may happen also for scrap.
The result is that copper has a substantial midstream segment between the mine and the end user of copper metal, before it goes into any manufacturing operation.
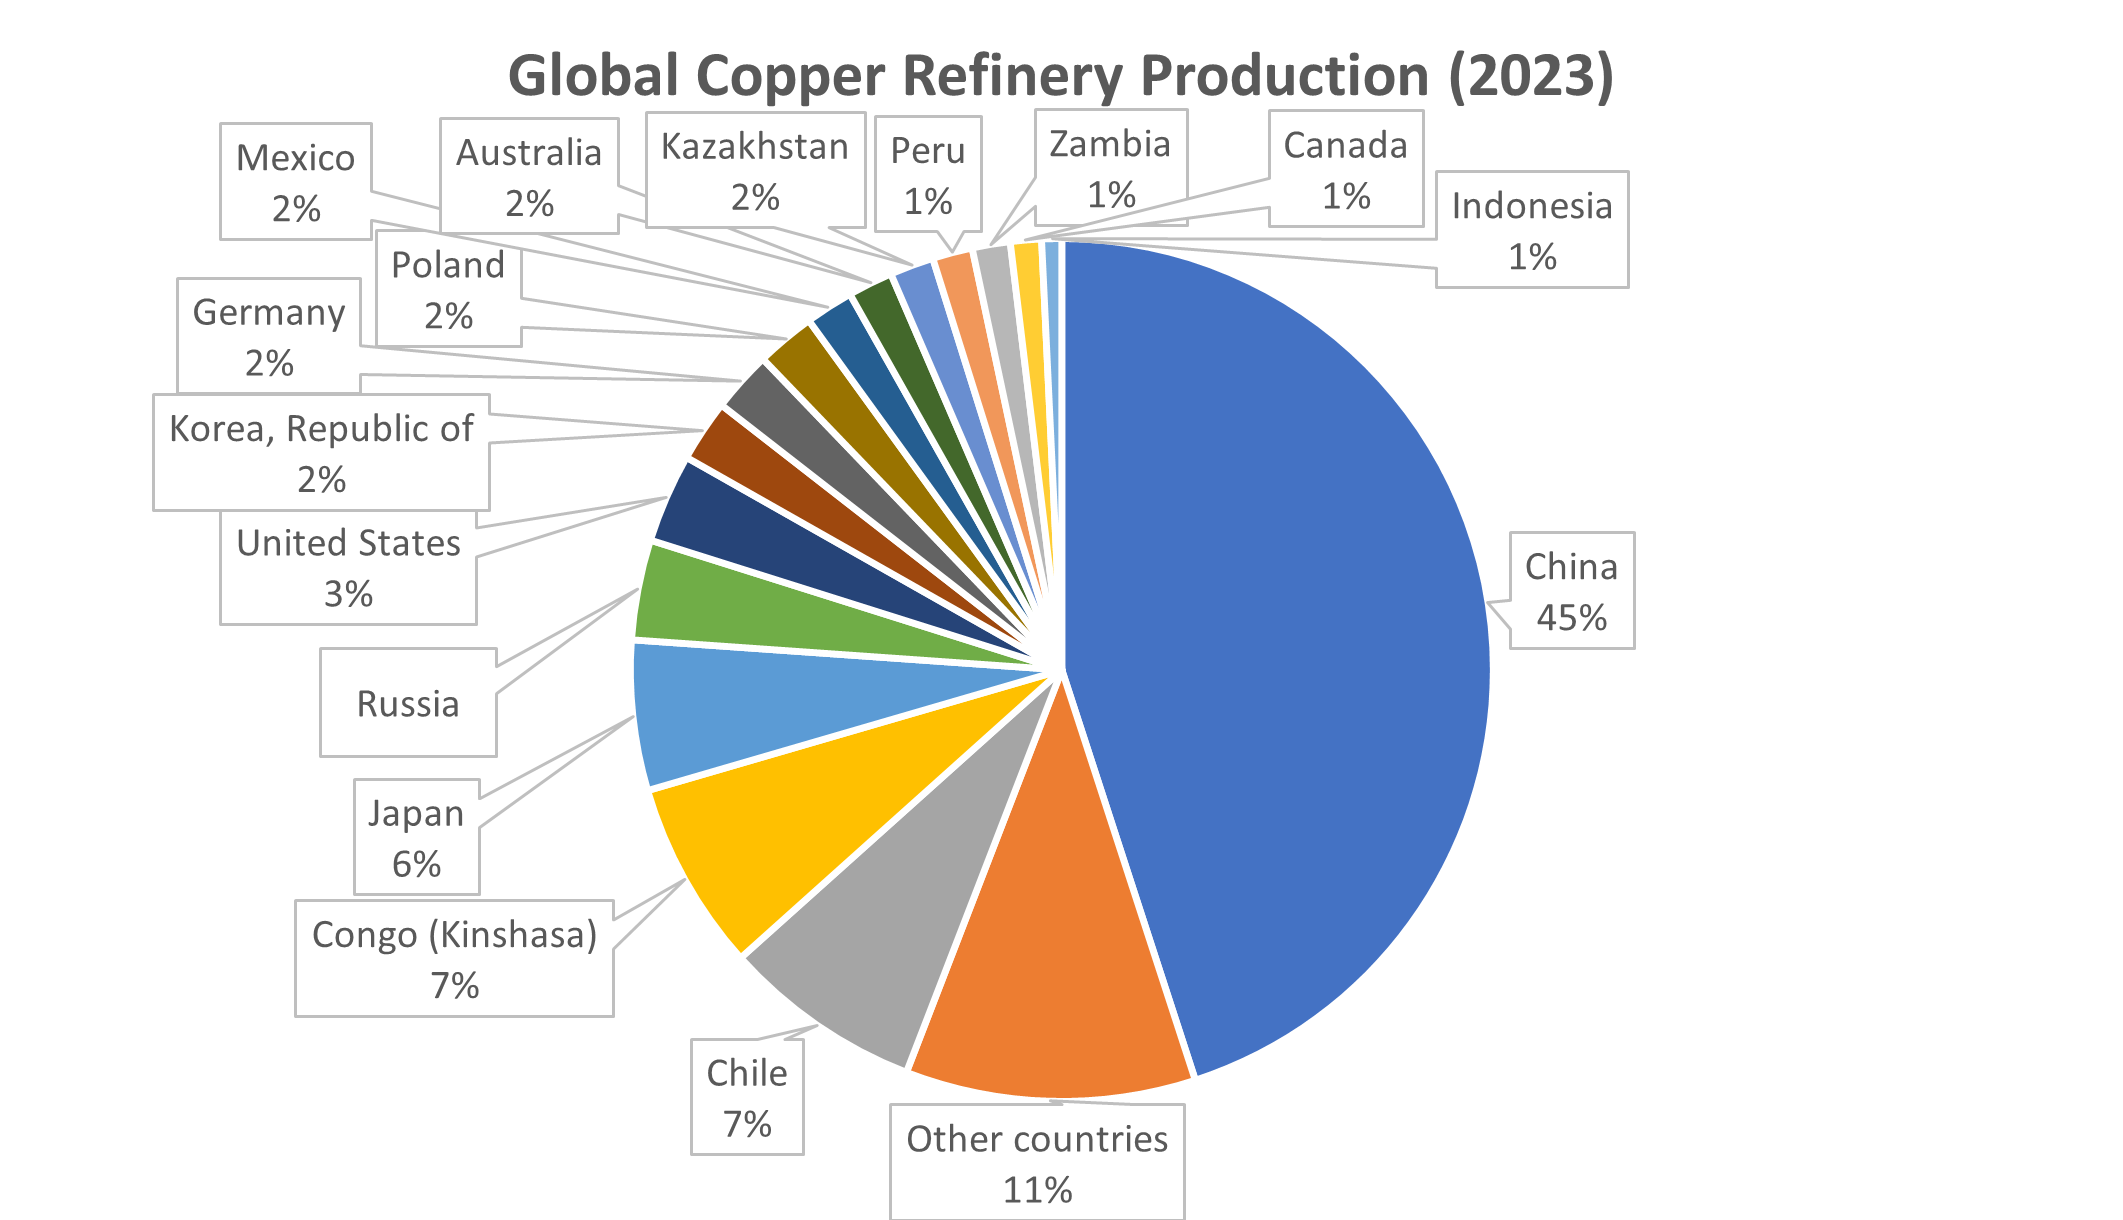
The USGS only provides those refinery statistics in the last couple of years. However, you can see from global copper production statistics that the market had healthy growth up until the period from 2016. This likely reflects some of the slowdown in Chinese construction activity since the CPC instituted measures to tighten credit access for real estate (Three Red Lines).
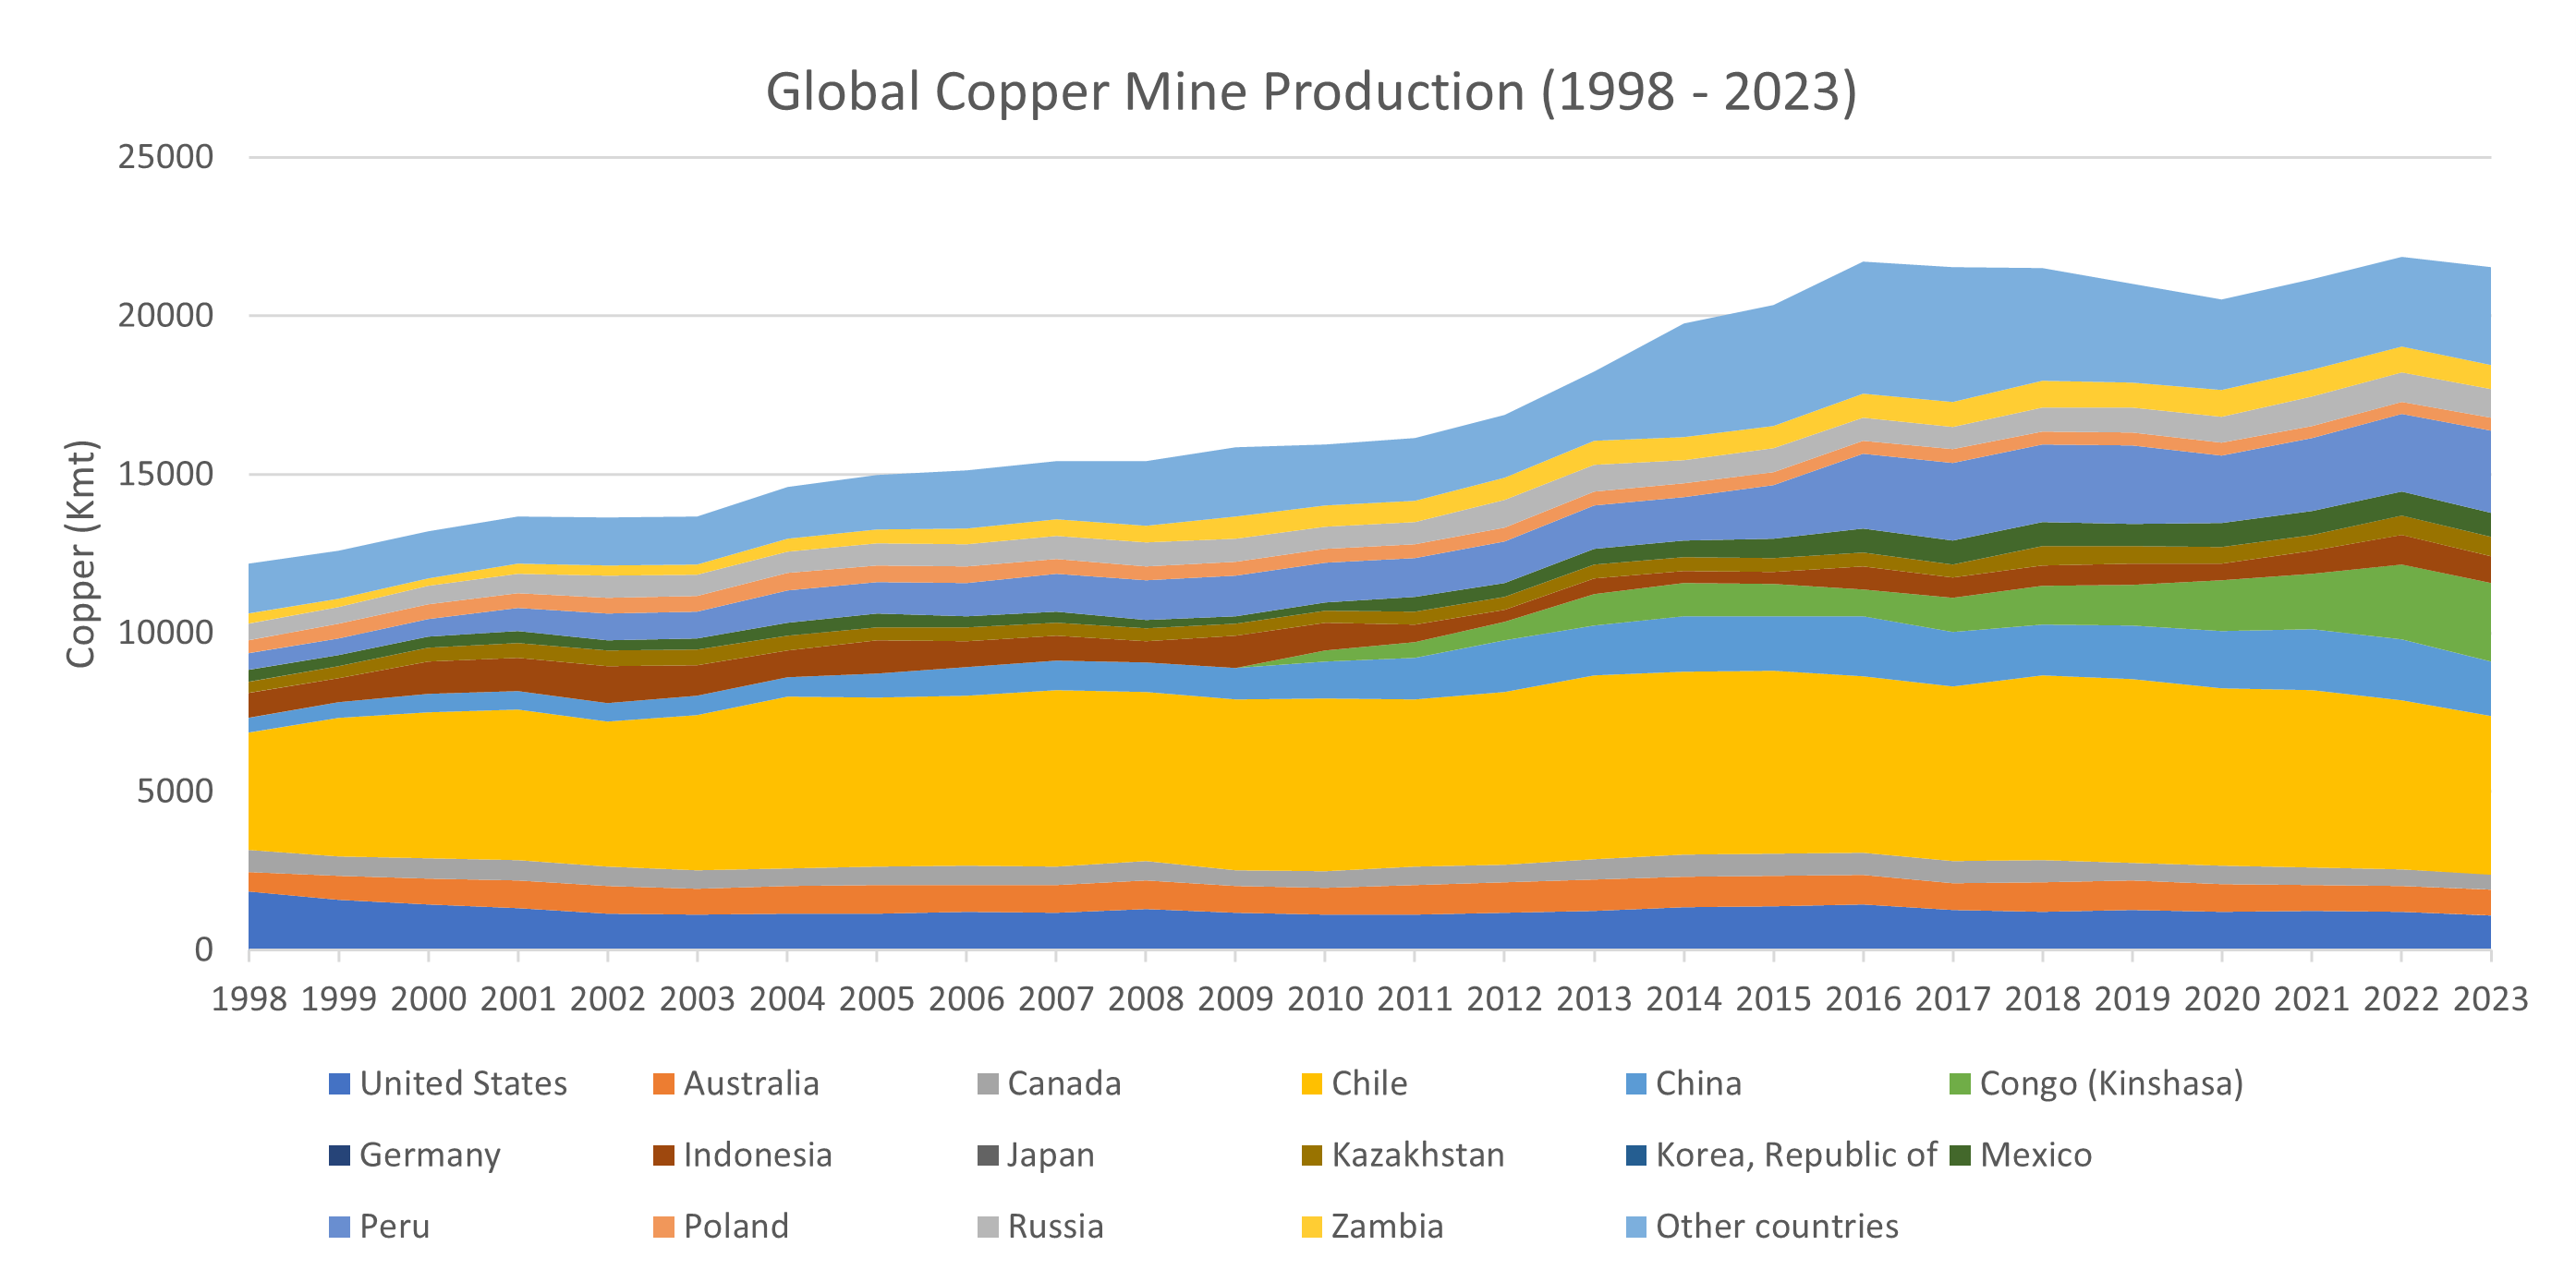
The USA market share has steadily declined over the past 25 years from around 15% of global copper mining to around 5% in the year just passed. US copper demand has probably gone from around 20% of market to less than 10% over the same period. With 5% of the global population, it is hard for the USA to consume much more than that.
The story of copper is one of the gradual shifts of demand into developing markets as the West progressively deindustrialized, and the built environment plateaued.
The sourcing pattern for copper has followed this general trend as you can see from compound annual growth rates of copper production. Development has concentrated in the undeveloped markets with large prospective resources. This is Latin America, Africa and Central Asia.
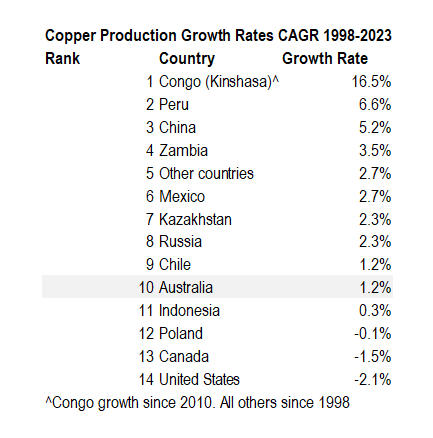
This table highlights the obvious. Regardless of the prospectivity of the ground, copper mining has gotten a lot harder in developed world countries. The high growth areas for copper mining are the Congo (DRC), Peru, China, Zambia, Mexico and Central Asia.
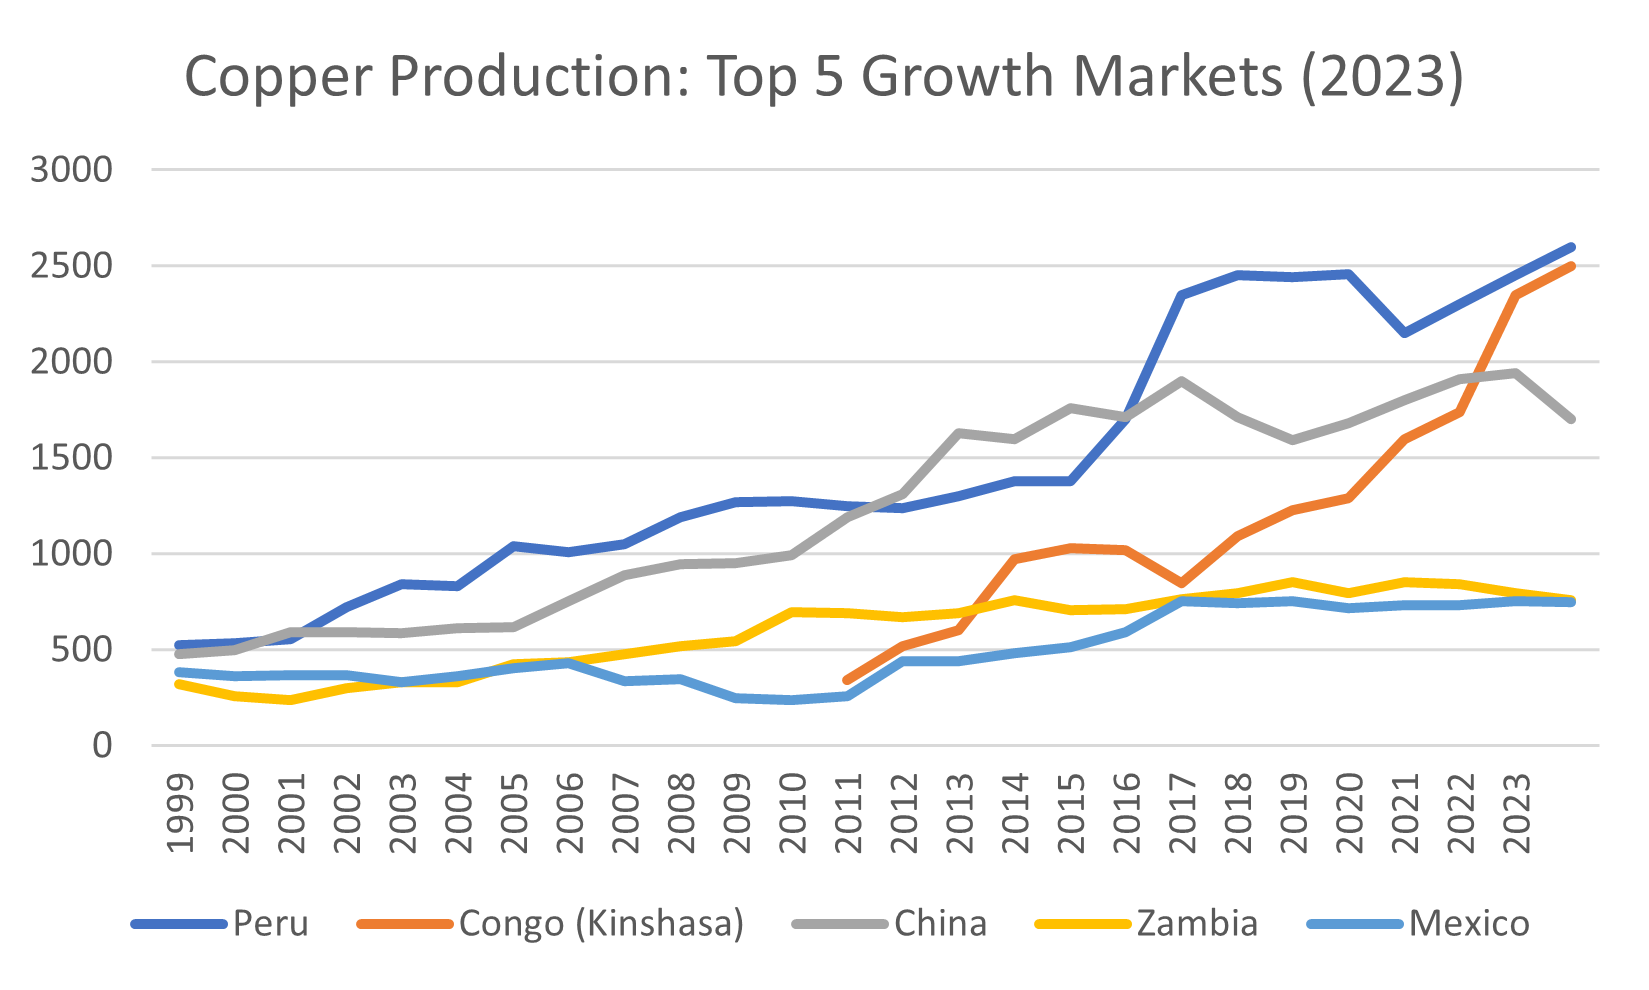
The majority of Australians would not consider China to be a major mining nation. This could prove to be a costly mistake for those who ignore the development of Chinese mining. You may be shocked to realize that China mines about twice as much copper as Australia.
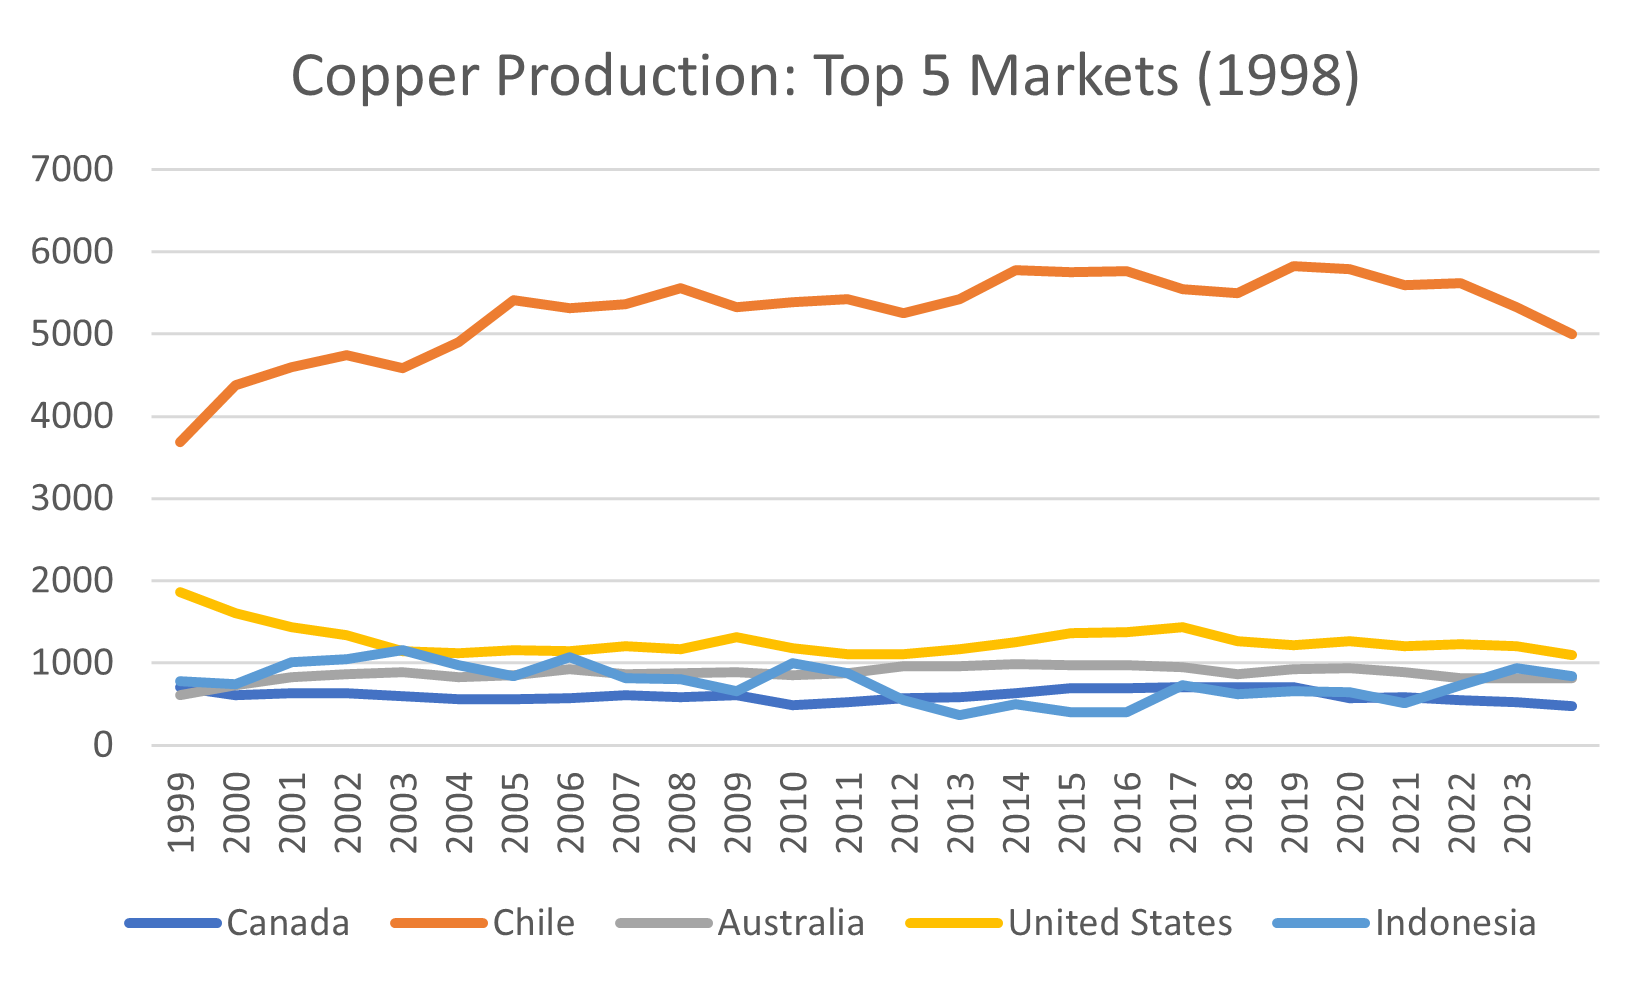
Of course, while Chile is in relative decline, it is still the biggest producer. Now that Chinese capital is developing mines in Peru, Ecuador and (possibly) Bolivia, I expect to see the contribution from Latin America to remain dominant. It is just so prospective.
This is the most rudimentary kind of economic geology possible. Those who practice the black art on a professional basis could tell you a lot more about future prospectivity.
As an example, you may want to bone up on the West Tethyan Belt.
What to do about misguided government policies?
One feature of contemporary government policy is the wide and growing disconnect between the stated policy ambition and the facts on the ground. Our own Resources Minister has said that she wants to compete with China in critical minerals.
Nice ambition. Good luck with that!
Investors are not like politicians.
Investors are judged by our results and not our words.
If you are in the copper mining business, you have to pay attention to where the action is. This is not in North America, the old copper belts of European Bohemia, nor even Indonesia. There is still action in Chile, but, as we will see, growth is getting harder because it is huge.
Australia has grown copper output modestly over the past twenty-five years. With the present state of national politics, the prognosis has only gotten worse.
The reasons for this situation are many and varied. Mostly they have to do with the Western trend of deindustrialization. The factors of production, such as land and labour, are too high. Since the real price of copper has not moved much in sixty years, we know that productivity growth in copper mining has at least kept pace with inflation. The same is not true of our labour pool in general services delivery. That is the price of being a rich nation.
Poorer nations do not have the same problem. Their problems are more immediate. How to actually develop the economy, generate foreign exchange through trade, and institute the policies necessary to support rising real incomes.
Not surprisingly, many developing nations in Africa, Central Asia, and Latin America, are able to do so by leveraging Chinese demand for commodities as an input to manufactures.
Recall that the real copper price reached extreme lows around the year 2000.
The price was so low that not even highly mechanized mines, of good grade, in the USA, were able to make much money. They all had to restructure to survive. That was a catalyst for the great migration of mining investor capital out of North America and into other markets.
This wave of investment only became so because of huge new demand out of China.
The key word here is demand.
You need demand, meaning you need willing buyers, to build mines.
This fact is lost on Australian politicians as they dive into the bewitching Washington DC policy plunge pool.
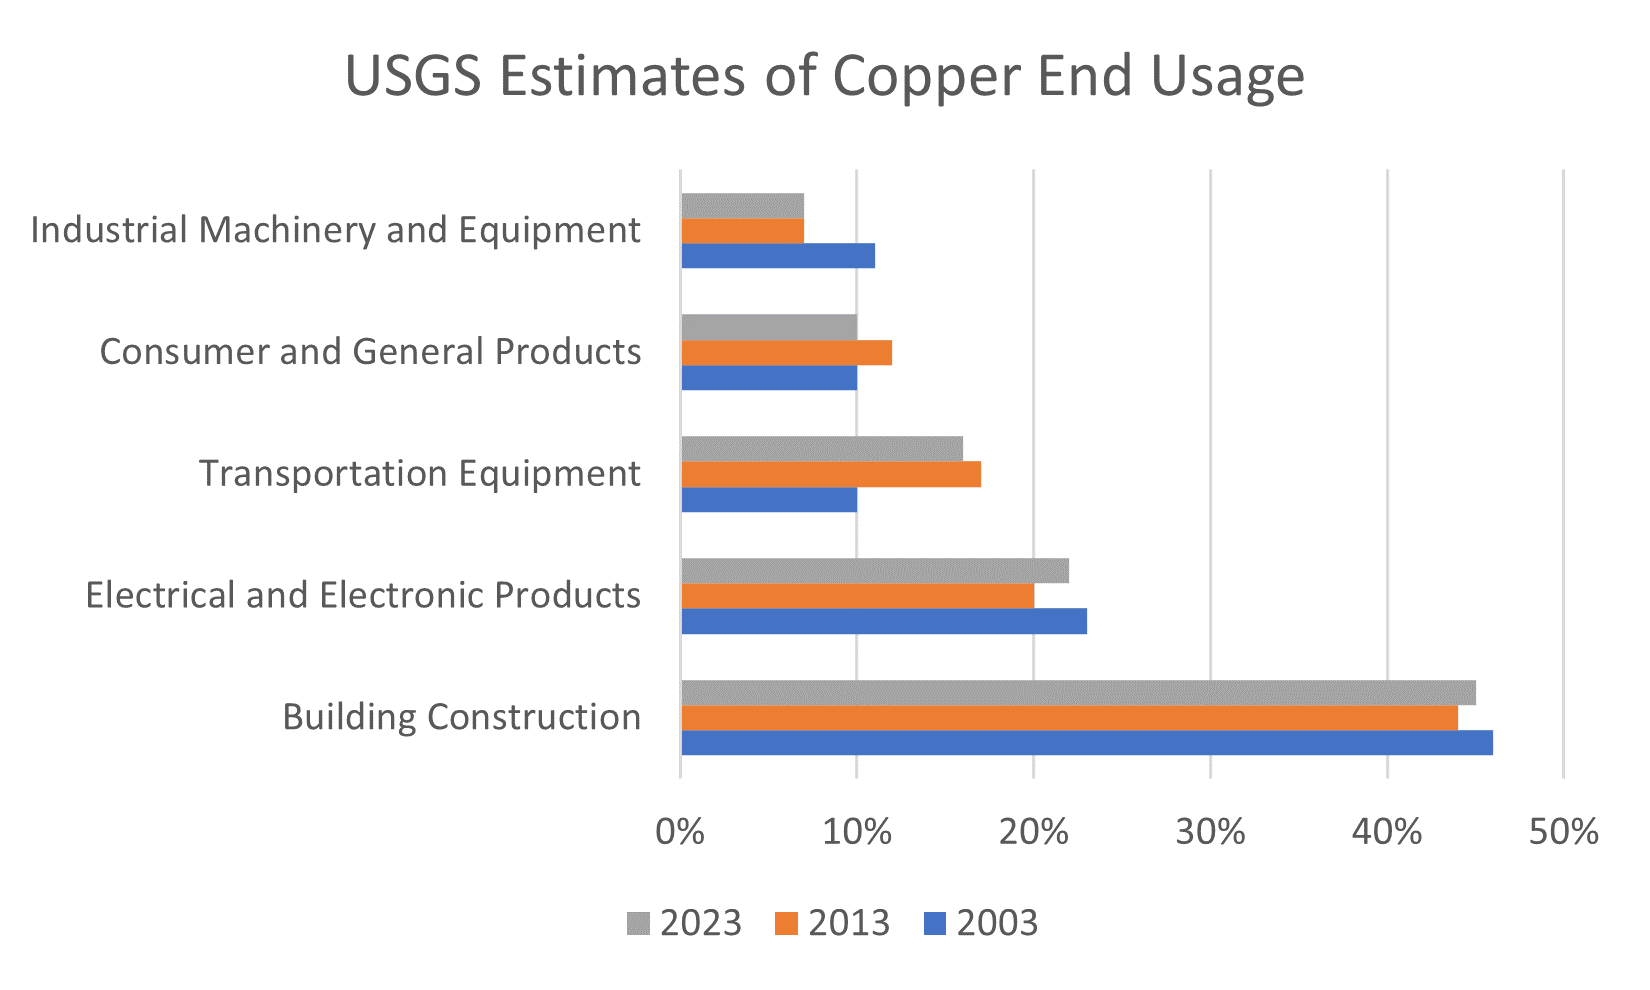
The bottom line is that real copper prices hit extreme lows in 1998 because the USA has largely deindustrialized. The place is largely built. The most recent figures for US end use of copper are stable, at around 45% for Building Construction, over the past two decades.
It is very natural for Americans, who live in the largest and best developed nation on Earth to suppose that they will set the price for important commodities.
That was true of copper, in the year 1998, when it was in the basement.
However, ever since China entered the WTO, that has changed markedly.
Forgive me for being blunt.
In my opinion, the USA is the last place on Earth that I would go to garner an informed view on the future direction of demand for any commodity other than oil and gas.
As much as we love Americans, they don't know much about the World Outside the Bubble. You don't seek out American opinion to understand how this world works.
We court Americans for their insight on how the world might be a better place. They know almost nothing about this world, so their ideas are often fresh.
Right now, there is not much of a contribution from that quarter on commodities.
From where I sit, most Australian politicians who have supped Martinis by the Washington DC Policy Plunge Pool return full of missionary deal to stop selling our commodities to China.
It is difficult for me, as an investor, to comprehend why this is a good plan for Australia.
Our copper industry is not growing right now, and the USA has enough copper. They have mine projects in Arizona that have been parked for twenty years over permit approvals. The USA has no problem with a shortage of copper.
The entire US problem in 1998 was a surplus of copper.
Australian politicians who travel this road are greeted by me with mirth.
You cannot shoot politicians, but you can laugh at them.
In short, to answer my own rhetorical question, there is nothing that anybody can meaningfully do about the parlous state of Australian minerals industry policy.
It all depends on whether Australia actually wants a minerals industry.
Like the USA, and Canada before us, Australians may have decided that they don't want one.
If that is true, then our present policy settings will all but guarantee that outcome.
What to do when you cannot change dumb domestic industry policy?
Investors are robust souls with a powerful instinct for self-preservation.
If the going gets tough, they just get the Hell out of Dodge.
They literally run for the hills.
If they are smart, they will steal the office stationery first, and the hotel cutlery. If they work in investment banking, they will buy a new BMW, on the corporate card, before it is cancelled.
This was put best by Canadian mining billionaire Robert Friedland.
Money is a coward.
He is absolutely correct. When you change the rules in adverse ways, like purposefully limiting the options for offtake by telling miners that they cannot sell to China, the money runs.
Money will never, ever, die in a ditch for a noble principle.
This is not the nature of money.
It just runs.
Always.
Where is my money running right now?
From the above, it should be clear where growth in new copper production has been most active. It should also be clear, that despite money printing, the real price of copper has remained relatively stable.
This speaks to productivity gains and the opening of new provinces.
The huge unanswered question relates to the clear slow-down in Chinese real estate and how this might affect copper going forward. Given the trajectory of nominal prices, it seems that the answer is: not very much. That is a puzzle that is worth investigating.
From a superficial standpoint, the progress of electrification in China, as part of CPC policy to move towards the new industries of solar power, electric vehicles and batteries may be key.
There has been endless speculation on what the real rate of GDP growth in China may be.
However, there is no evidence of a growing copper mountain in China, and plenty of evidence of a construction slow down. You would think, in this circumstance, that China would remain keen to see lower prices for key commodities.
Interestingly, copper prices jumped 5% last week on stories that the Chinese copper refiners and smelters were moving to cut output as margins were too low. If you have a deficiency in the demand for copper, you can understand why refiner margins might shrink.
The fact that prices rose suggests that demand is real, but margins are poor.
Anecdotally, Chinese refiner margins are generally around 70c per pound, but are now down to about zero. This suggests that Chinese price control activity may have been too aggressive in preventing the true economics of copper refining from passing through to finished prices.
With a recent price below $4 USD/lb the clearing price may well be towards the higher end of the range $4 to $5. If you compare this range to the real copper price chart, you can see that this is plausible, and simply reflects a typical trading range.
Chinese data is clear as mud, but folks don't buy copper to hang on the wall.
This is not the Art Market for billionaires.
Price does matter, and Chinese refiners control 45% of global smelting capacity. If they decide to limit output to restore margin, then it is the finished copper that will be rationed.
Ergo, the price of copper should rise from here.
Perhaps by $0.50 to $0.70 USD/lb to restore margin.
China needs the copper for its current Five-Year Plan.
Of course, nobody told Goldman Sachs.
Perhaps they could not take the call because they were bidding at Sothebys?
My favoured names in copper
It is not enough to punt a commodity on a transient view for a one-week price move. There are other factors at work here which seem to be tightening the global copper market.
First Quantum had to close their Cobre Panamá mine due to an adverse Supreme Court ruling concerning local protests over environmental standards. Down in Zambia the lack of water has affected provision of hydroelectricity to energy intensive copper smelters.
Meanwhile, Chinese EV leader BYD reported that their retail penetration for NEV sales, a figure that includes both full electric vehicles and hybrids, just exceeded 48.2%.
"The penetration rate of NEVs crossed 48.2 percent last week, and if it continues at this rate, I estimate that the penetration could cross 50 percent in the next three months," (Wang Chuanfu, BYD)
The contemporary financial press is mostly concerned with fighting the good fight to hold back the tide of communism. I have seen this before. Lived through 30 years of it. Over it. Totally.
I see an energized nation in China that wants to sell a ton of electric vehicles.
On the evidence of BYD HKG: 1211, a stock that I bought in December 2023, I think they will be very successful in this new policy direction. You cannot ship unfinished apartment blocks and weird faux-French executive chalets to foreign buyers. However, you can ship cars.
Call me a simpleton, with no idea, and very limited financial markets experience.
I have only lived on Planet Earth for 61 years and been active in markets for 30 years.
The first 15 years of my professional career I spent in Cold War I, as a cog in the military industrial complex, pumping out papers nobody read to combat the Russians.
I don't bother doing that anymore.
The bulk of my advice to the political community is that Ukraine won' t be winning any war anytime soon if they run out of ammunition.
They don't listen because they have no idea.
The place my money is running to is the three top provinces for copper.
You have read the case notes. That is Chile, for strength, Peru and DRC for growth.
If you do the work, the three names in gold stand out.
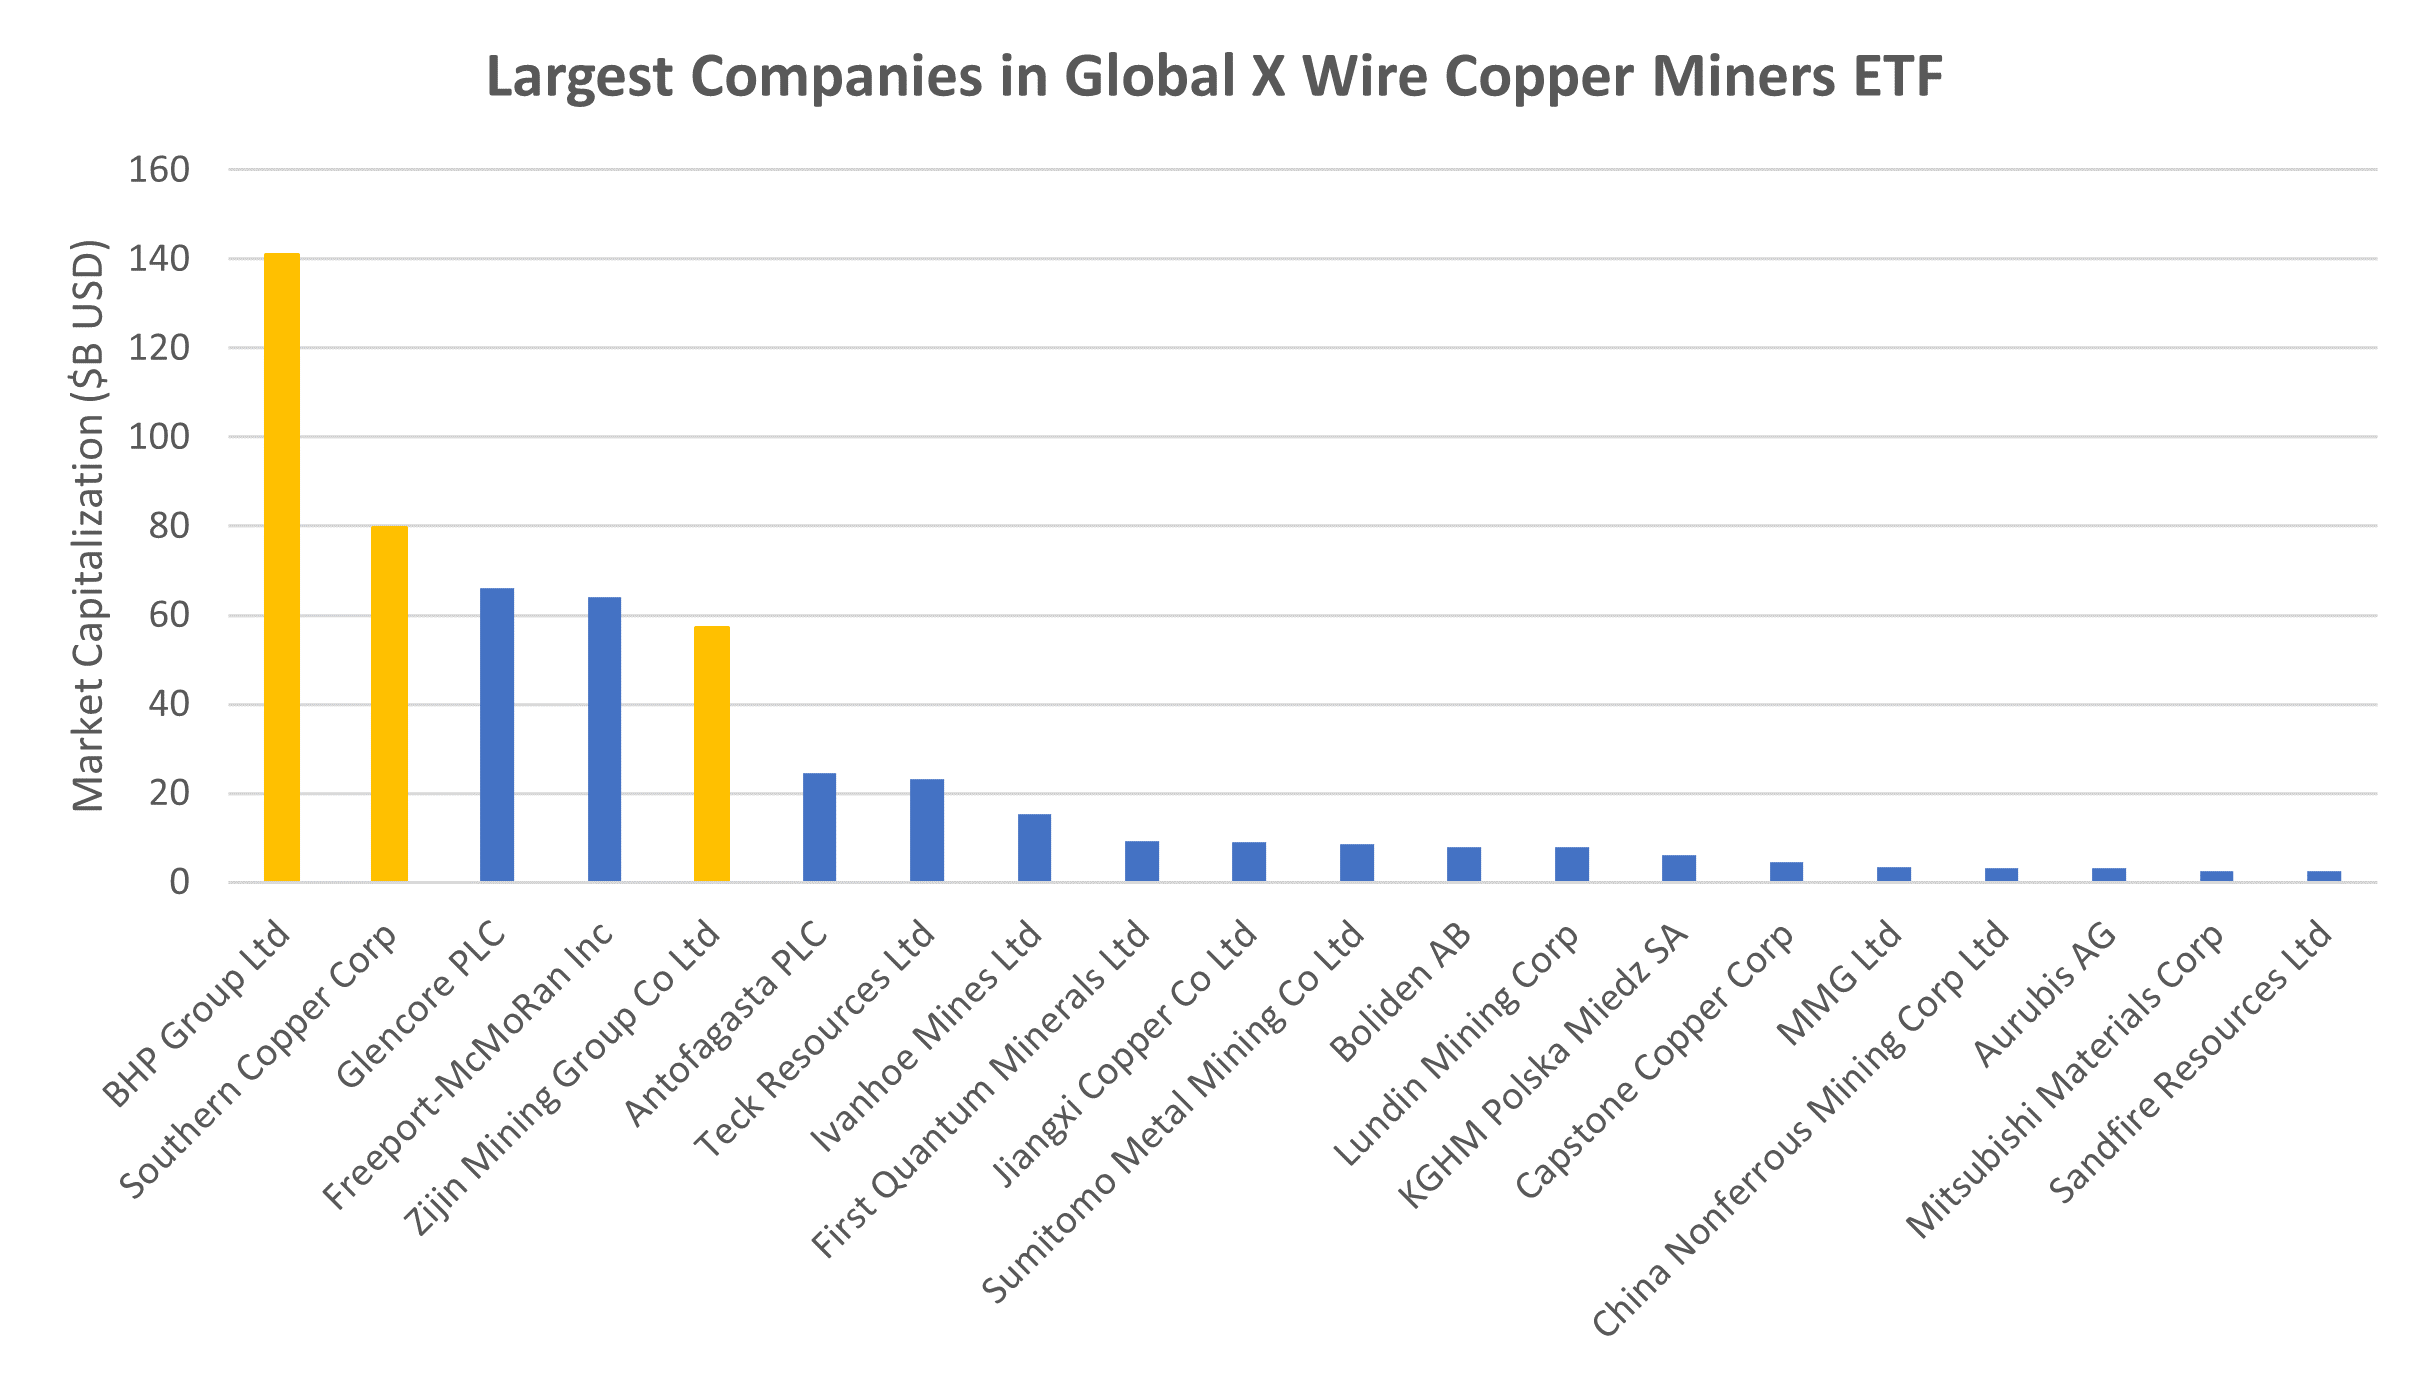
To put my personal selections in context, I have taken the top 20 names from a global copper miners ETF. This one is ASX: WIRE, which you can buy on the ASX at a fee of 65 bps. This is not something I own, because I like to pull apart the ETF and buy fewer names at no fee.
The three names I chose are:
BHP Group ASX: BHP which has 30% copper revenues from Chile and Australia
Southern Copper NYSE: SCCO which has long life copper assets in Peru with handy Molybdenum credits that lower their production cost to about 70c USD/lb.
Zijin Mining Group HKG: 2899 which has the best growth profile in copper-gold I know of.
The last one will not be popular with those fighting the good fight against communism.
Like I told you, and with Robert Friedland, I think money is a coward.
It goes where it thinks it will be pampered.
Oddly enough, for me at this time, that is looking like China.
My guess is that the lead guy, the one who looks like the bear with the honey jar, has made up his mind that debt deflation would be a bad thing for China.
We don't know for sure, and I have no connections into China. However, I do harbour the view that the Chinese Communists are fundamentally a bunch of mercantile traders.
Previously, the National Development and Reform Commission (NDRC) might have been clear on the need to prevent inflation harming national productivity. They would have tried to stamp out any collective action from smelters to raise copper prices.
Call this a hunch, and an unproven one at that.
However, I think that, on this occasion, they will just look the other way.
Our own officials looked the other way when Ukraine ran low on ammunition.
Chinese officials are people too. They will look the other way when it suits them.
This is not yet a confirmed bull market for copper, but I am acting like it soon will be.
Gold is in a confirmed bull market.
Uranium is in a confirmed bull market.
Copper is in a transitory state of extreme trading interest.
I terminated my doubts by going long.
Perhaps wait, as I am too early at any good party and too late to leave.
The Red Dog has my full attention, and I am happy to follow her lead.
Nice dog. Looks very sweet and that breed will save your bacon in an avalanche.
Photo by Gary Sandoz on Unsplash
5 topics
3 stocks mentioned
1 fund mentioned

