TOL - 27th Mar, 2025
A growth business deserving of a Praemium
Praemium (ASX:PPS) is a growth business trading on 10x forward earnings, with EPS growing >20% for the next 3 years.
Two of the greatest Australian business success stories of the last two decades are Netwealth (ASX:NWL) and Hub24 (ASX:HUB). These companies operate investment platforms catering to independent financial advisers and have grown from starts ups to become multi-billion dollar companies that are well owned and appreciated by the public market.
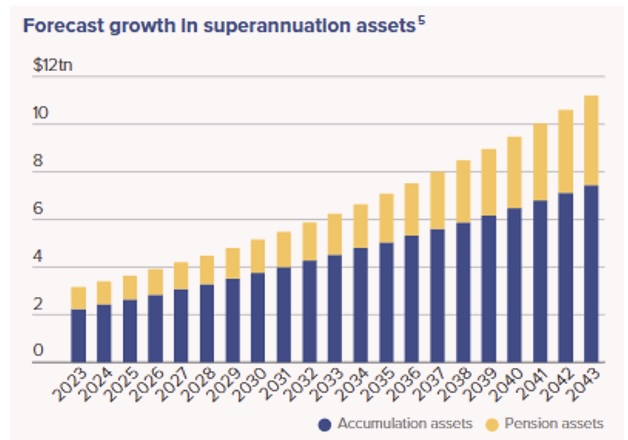
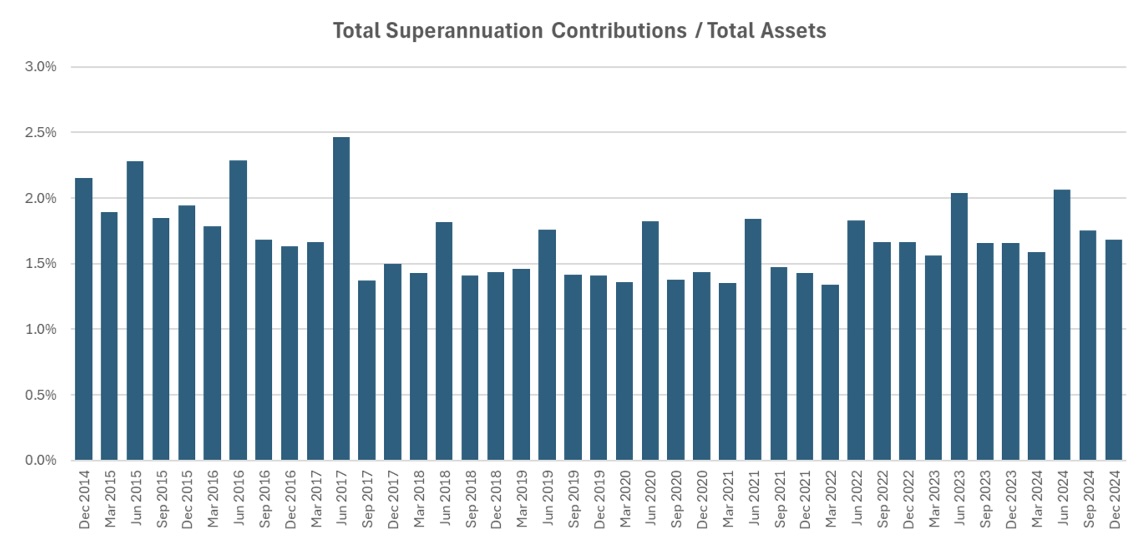
Their popularity is driven by several favourable qualities being: 1) Certainty around their long-term growth due to tailwinds from mandated super contributions, 2) flows from aligned incumbent platforms (e.g. bank owned) to independents and 3) the fact that markets (and the wealth of Australians) tend to rise over the very long term.
The businesses also possess attractive economics with sticky clients, operating leverage, high margins and healthy free cash flow. As a result, both NWL and HUB trade on lofty earnings multiples and are well owned by institutional and retail investors.

Never miss an update
Get the latest insights from me in your inbox when they’re published.
Advertisement
However, there is a smaller operator in the space with the same long-term tailwinds and business economics, that trades at a fraction of the multiple, despite consistently growing its market share over decades. It is either unknown to most investors or, for those that know of it, underappreciated.
That company is Praemium (ASX: PPS).
History and Business Model
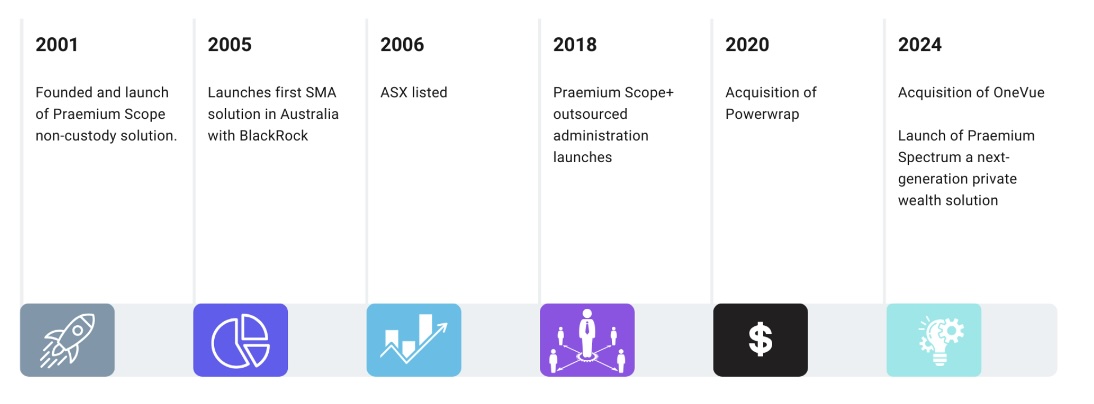
Praemium was founded in 2001 to provide a full-service administration and reporting platform for investors. The software (Scope) is B2B, servicing wealth managers and stockbrokers who then provide the service to their underlying clients, often via white label. In 2018 the outsourced administration service line was added to the offering (Scope+).
Today, this business holds the dominant position in the non-custodial market (i.e. assets held directly in the name of the investor), significantly ahead of both HUB and NWL, generating $20m+ revenue per annum primarily via a fee per portfolio.
It is a mission critical piece of software that becomes entrenched in the client’s operations and has built up a moat around the breadth of assets it can account for and manage taxation on.
As an active investor, there is a very good chance you use the Scope/Scope+ product without realising, given it will be branded by your broker/adviser (ask your adviser who generates your admin and tax reporting!)
In 2005, PPS launched the technology to administer Separately Managed Accounts (SMAs), providing the first ever SMA solution in Australia with Blackrock. This business forms the bulk of revenue today and is more directly comparable to the platform businesses of NWL and HUB.
Revenue is generated from platform fees (% of FUA), transaction fees and cash margin. $70m+ of annual revenues are generated from the platform side of the business (SMA, PWL, Spectrum).
In 2020, PPS acquired Powerwrap (PWL), a platform with a focus on high and ultra-high net worth clients, a niche that PPS continues to dominate, at least in part due to the complex tax reporting capabilities and wide range of non-custodial private assets that can be reported on. That said the PWL acquisition, while it has now stabilised, has at times masked the underlying strength of the core PPS businesses (Scope, Scope+, SMA and now Spectrum).
In 2021/22 PPS sold its international business to Morningstar for $62m. This completed the resumption of focus back on to its high growth Australian business, bolstered the balance sheet (c.$40m net cash today) and is worth noting whenever you analyse past performance, as the international business needs to be stripped out.
It was in 2017 that the current board was installed. Board ructions and management change around this period, as well as the acquisition of Powerwrap, are all valid reasons for why PPS is under appreciated, and therefore trading cheaply today.
The intention of this wire is to analyse the underlying performance of PPS to date, and the prospects for growth moving forward, to show why we believe PPS is a good quality company with a great outlook trading at a very attractive price.
Same Tailwinds, Different Valuation
Mention PPS to any investor and you’ll probably be asked the question, but how do they compete with NWL and HUB?
You could try to answer it qualitatively. Explain that the core PPS SMA offering is different to NWL’s broader wrap offering, and it is only the recent launch of Spectrum that makes them comparable. Or that PPS dominates the (much faster growing) niche markets of HNW/UNHW and private assets.
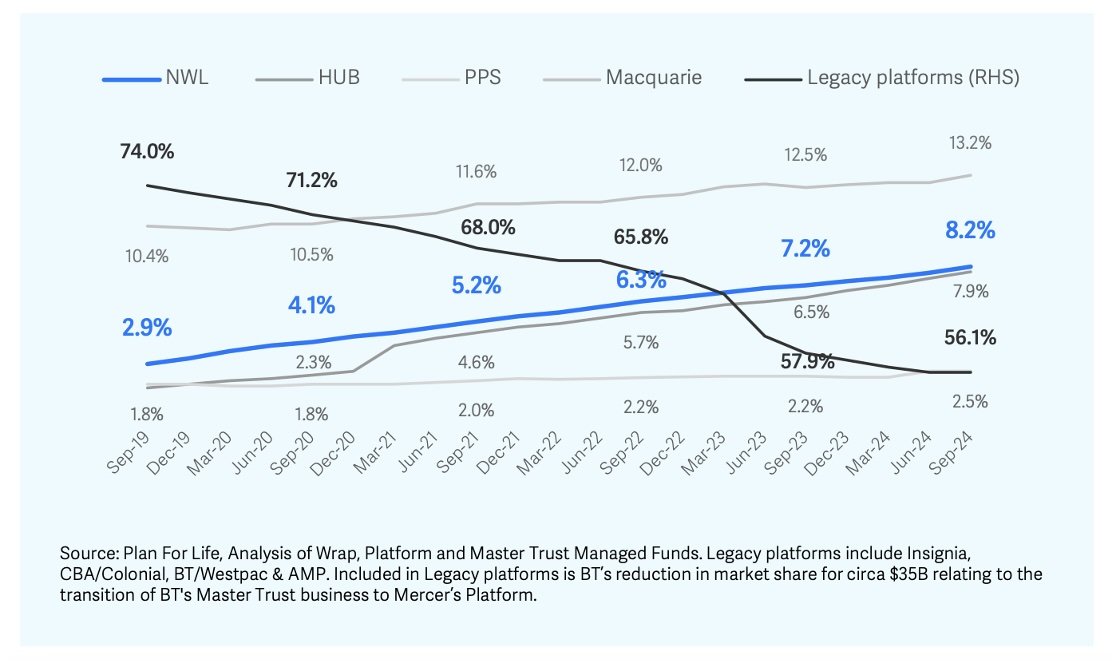
But the simple data is more powerful and shows that PPS is doing a great job against not just NWL and HUB, but all platform competitors. Total market share has grown from 0.5% in 2016 to 2.5% today within a growing overall market.
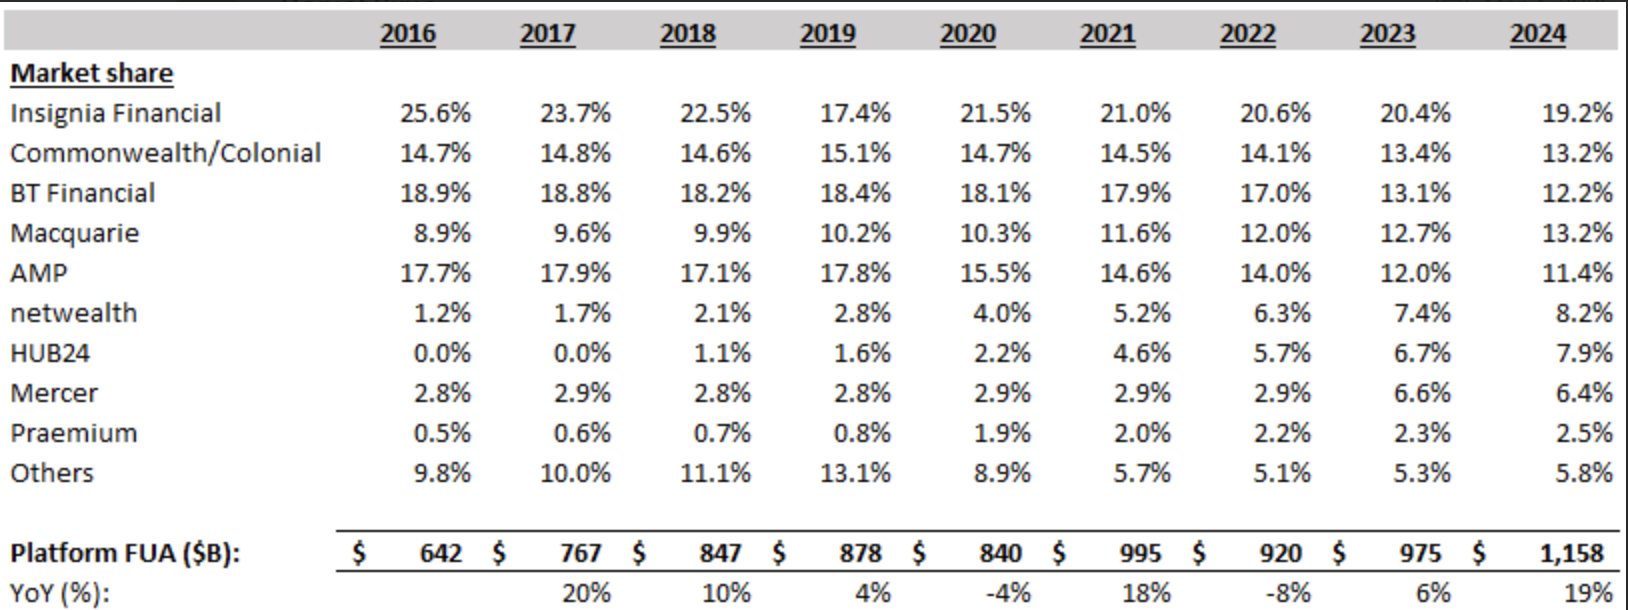
It is well known that the thematic driving the growth of the independent platforms is not just the ever-growing pool of investment assets, but the migration of FUA away from aligned platforms (i.e. those owned by banks) to the independents. Advisers left the legacy platforms and shifted their clients to independent dealer groups or started their own self-licensed firm.
What is perhaps less known is that while that FUA shifted very quickly at the adviser level it has moved far slower at the platform level and continues to transition at 1-3% per annum. The slower pace is driven by the stickiness of the FUA, tax implications and the fact the adviser can take new money on the independent platform and gradually shift the back book over time.
The below graphic shows the rising share of independents and the continually declining share of legacy platforms. The important point to note is that despite the significant decline for legacy platforms, they still hold >50% of the market, which continues to shift to the independents providing a tailwind for many years to come.
Why has PPS been able to consistently grow market share?
Part of it is due to their focus on the high net worth segment and private assets, both of which are growing faster than the overall market.
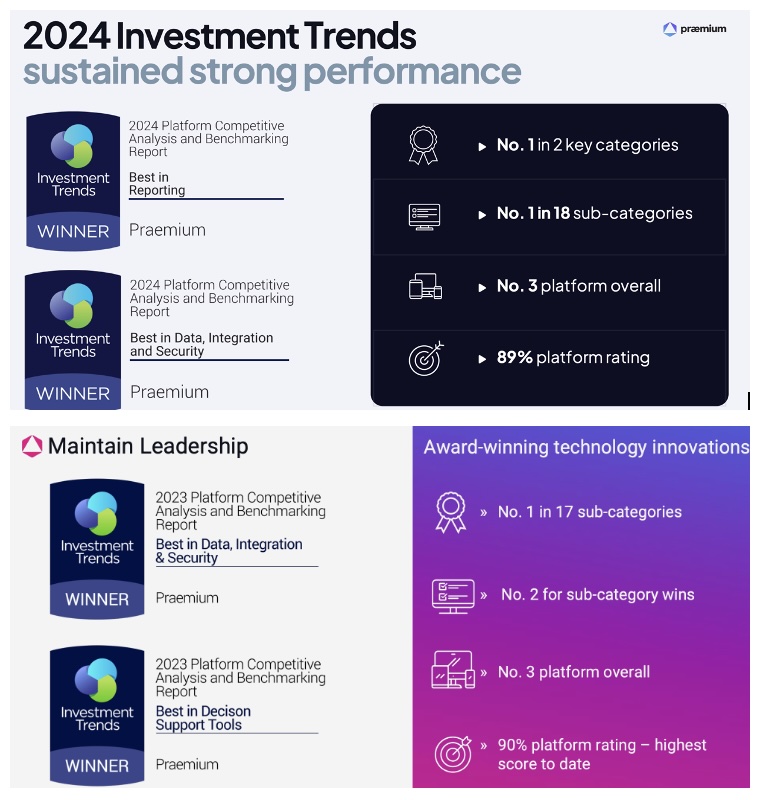
But it is also a result of PPS’s ability to differentiate at a product level, supported by independent analysis and surveys of advisers (see below).
PPS has been a significant beneficiary of the shift to independents which should continue for the foreseeable future as both the overall pie grows, and independents like PPS take a greater share.
If PPS were able to simply maintain static market share over the next decade the growing overall market should mean PPS would become a significantly larger business, but the data suggests they have an ability to grow their share within the overall growing pie.
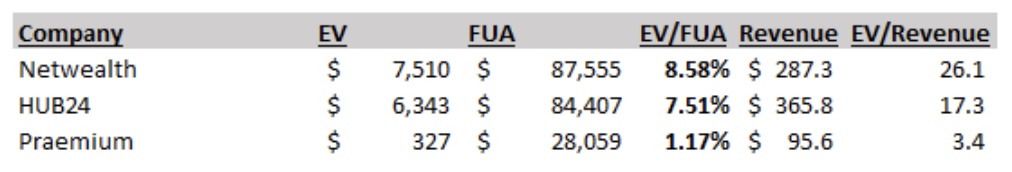
And for a hint of how undervalued the stock is, NWL and HUB have roughly 3x the market share of PPS, yet 15-20x the enterprise values.
Zoom Out - PPS is a Solid Grower
We touched earlier on the fact that the underlying growth of PPS has been masked by varying factors over the years – board change, the operation and eventual sale of the international business and the Powerwrap acquisition.
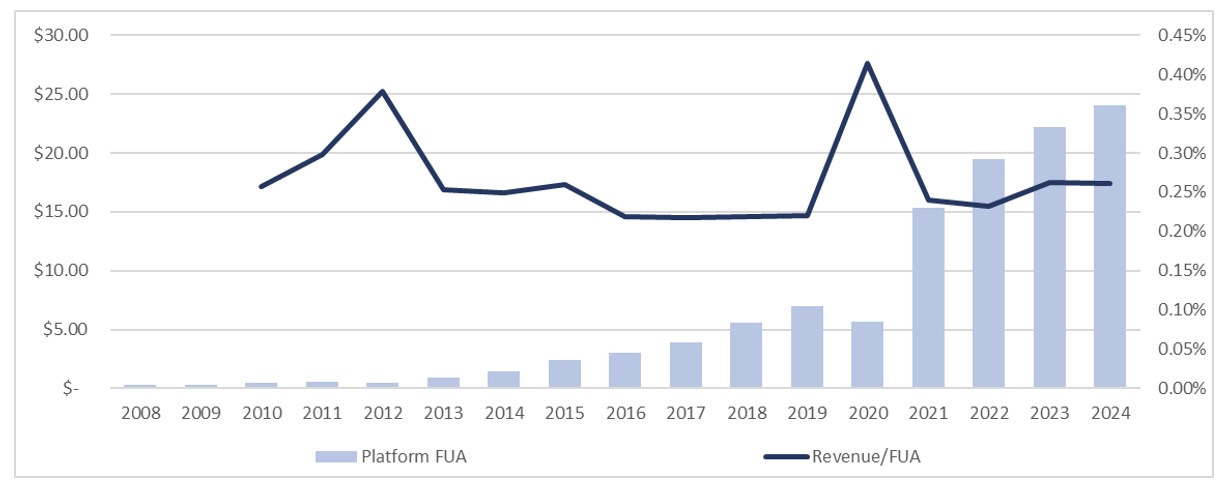
When you zoom out and focus solely on the core Australian business, the consistent growth becomes clear. The graph below shows Australian revenue (ex the international business) and EBITDA margins from 2008-2024. It has generated double digit annual revenue growth for a very long time.
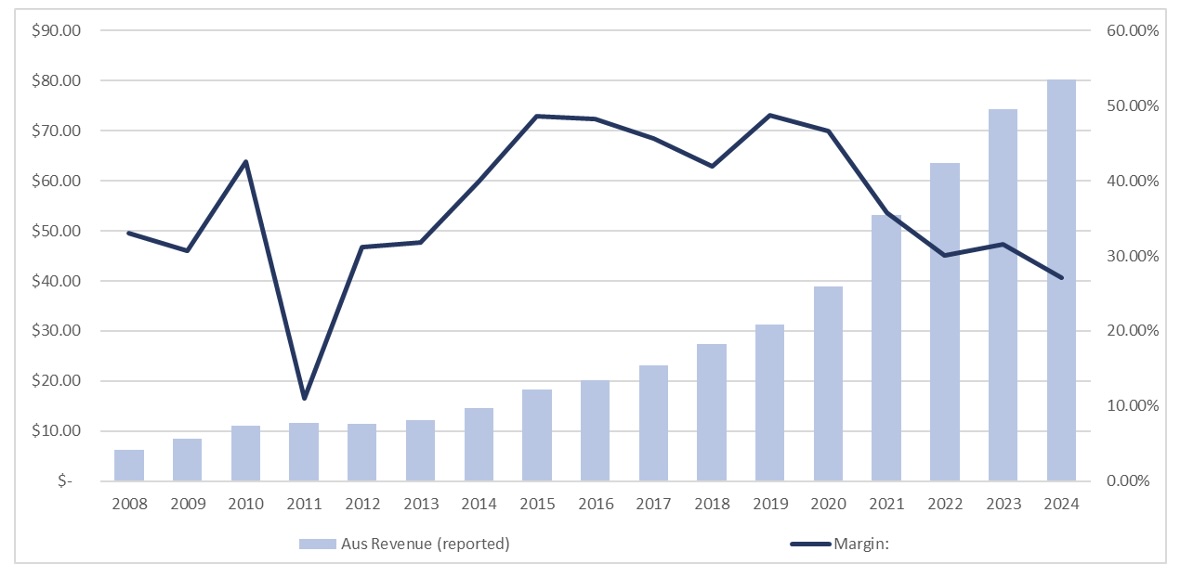
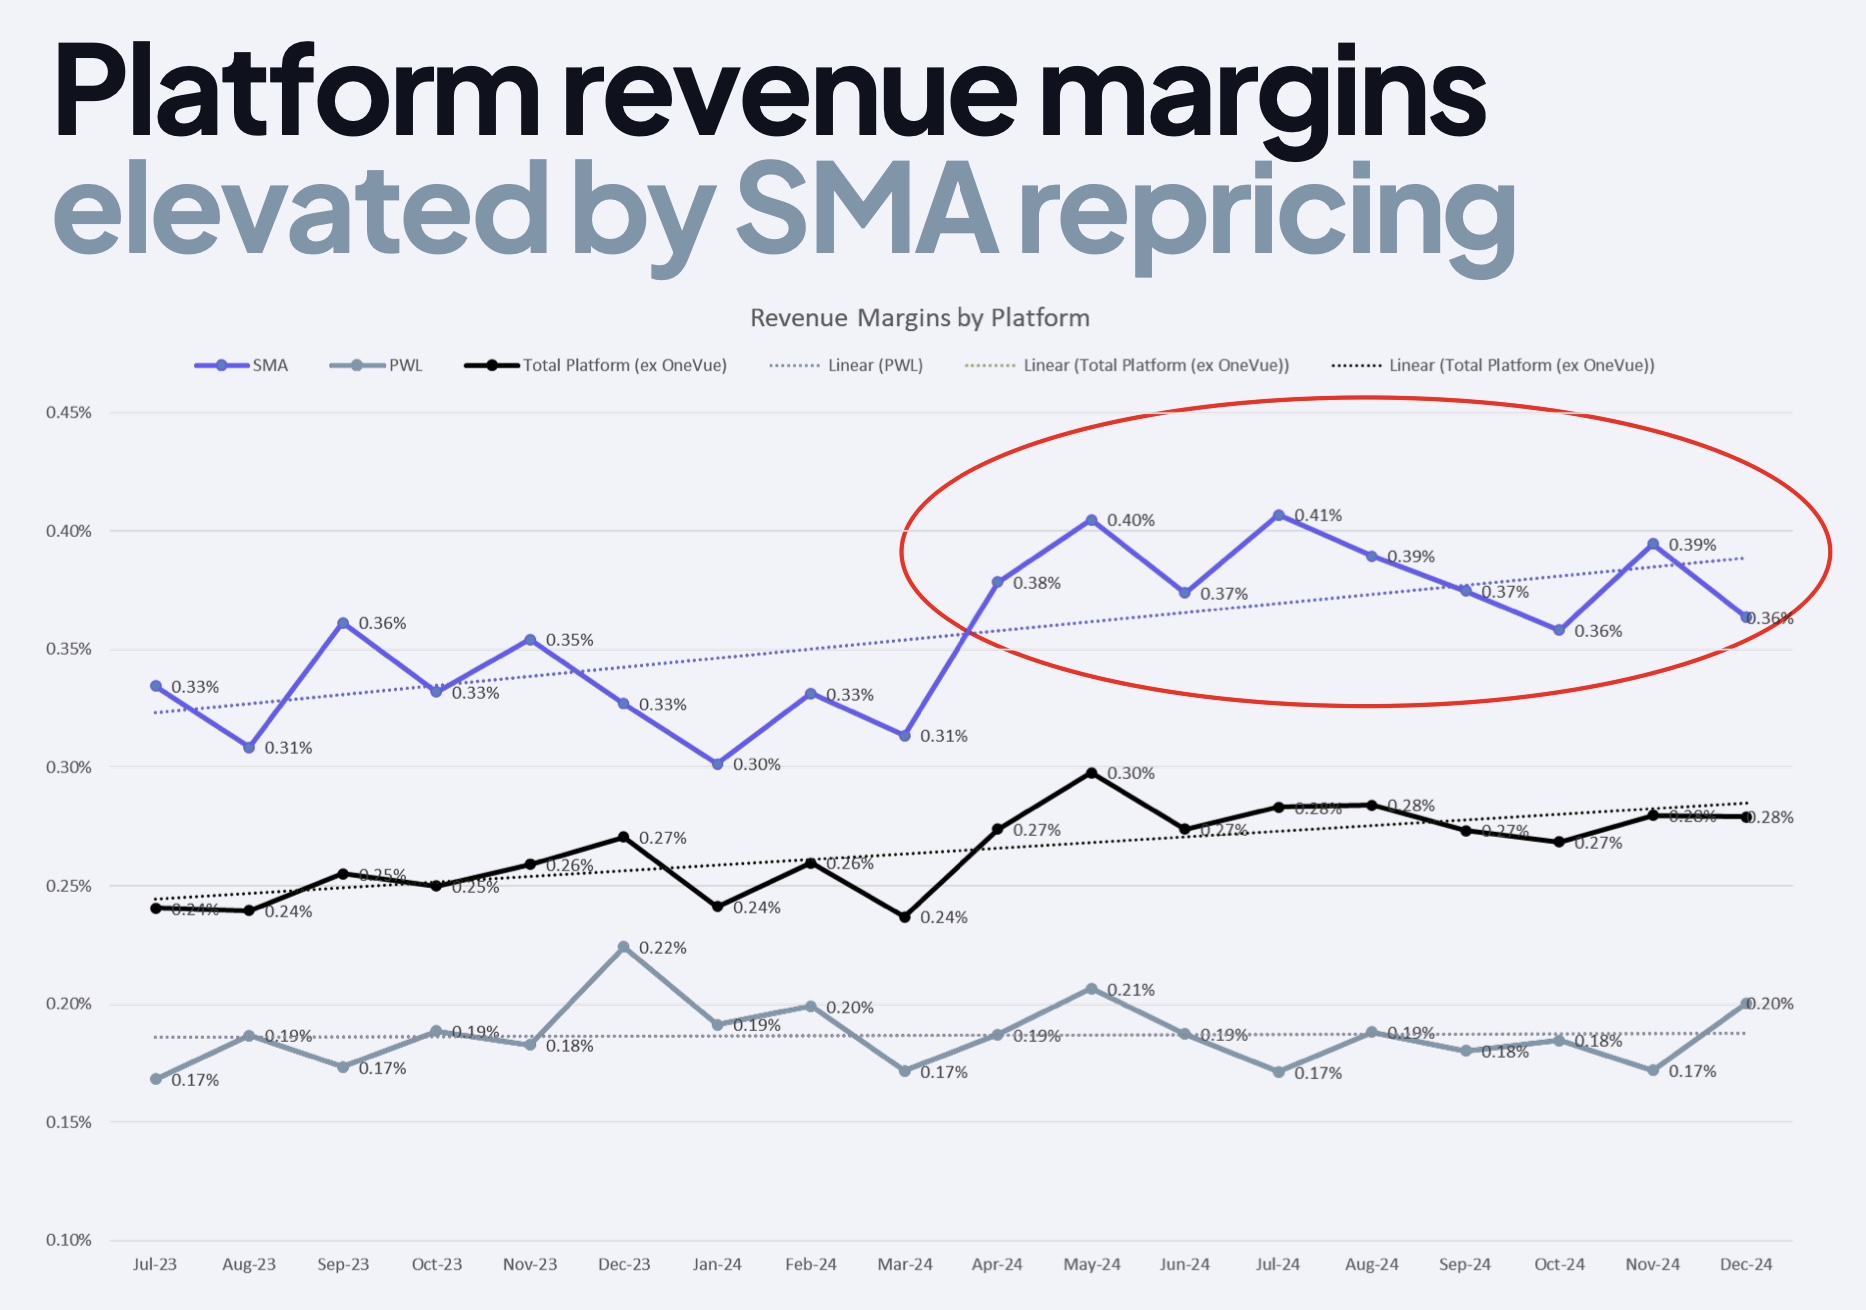
Within the platform business, a key metric to watch is how much revenue is generated per dollar of FUA (Rev/FUA). The graph below shows that it has remained consistent over many years, even as total FUA has grown significantly. It demonstrates PPS has been able to maintain pricing power, as have NWL and HUB too, despite significant growth over time.
A key part of our thesis is management achieving their target of margin expansion towards 35-40% as revenue grows (and factors like the recent OneVue acquisition normalise the shorter term impact). The economics of the business suggest this is readily achievable.
Return To Net Flow Growth
We touched on how the Powerwrap (PWL) acquisition has masked the growth of the core business and this was most evident in 2023/24.
Advisers move between banners (dealer groups) all the time. It can be driven by various factors, but it is usually driven by the allure of better economics or growth prospects.
Often this shift has no impact on platform FUA. Advisers might keep using the same platform at their new group or they might keep their back book on one platform and put new clients on the new platform.
As an independent platform, PPS has been a significant beneficiary of these shifts over time.
But in 2023/24, a group of advisers moved away from Escala (a large PPS client via the Powerwrap platform) to join LGT Crestone.
Crestone mandates that advisers use their own internal platform. This forced FUA off PWL and impacted net flows for that business over the proceeding 12 months.
In late 2023 an AGM update detailing this exodus of advisers, along with a short-term increase in wages and technology investment, caused the stock to fall -40% in a day. It was at this point that we acquired our stake in PPS, and over the following year it grew to become (and remains today) our largest position.
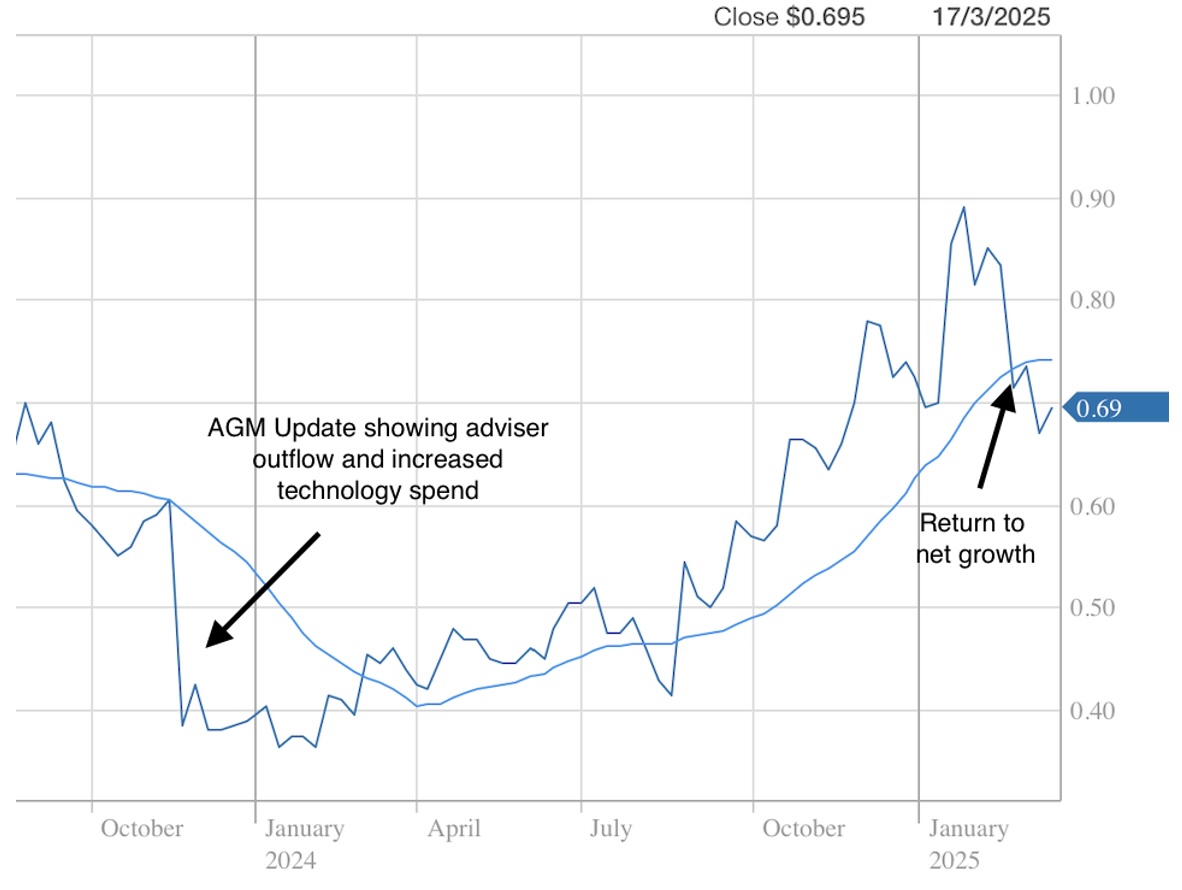
It was our view that this was a temporary issue impacting a good quality business with a great long-term outlook.
Since then, outflows related to those Escala advisers has slowed and both PWL and the PPS Group have returned to net inflows.
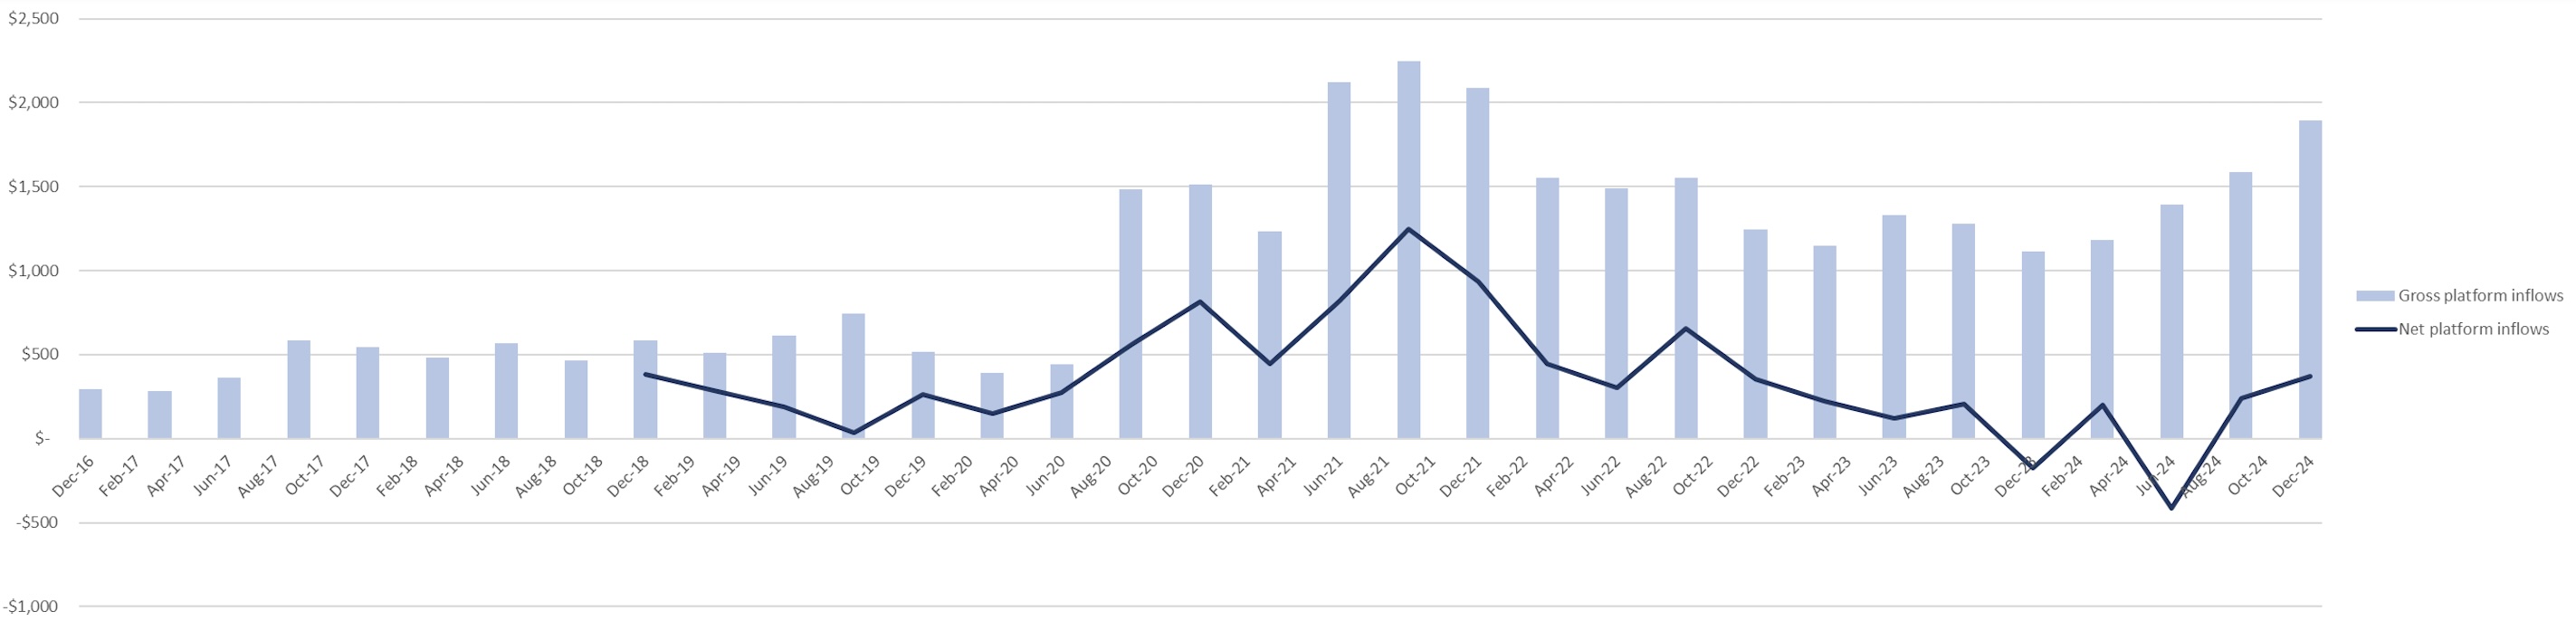
Again, advisers moving is not unusual. It was the fact these advisers both represented a material chunk of FUA and moved to a group that mandated an internal platform causing the FUA to shift.
As an example, a small group of Escala advisers recently moved to Koda Capital. As Koda is already a PPS client, the revenue impact should be nil.
OneVue Acquisition – A Well-Structured Deal
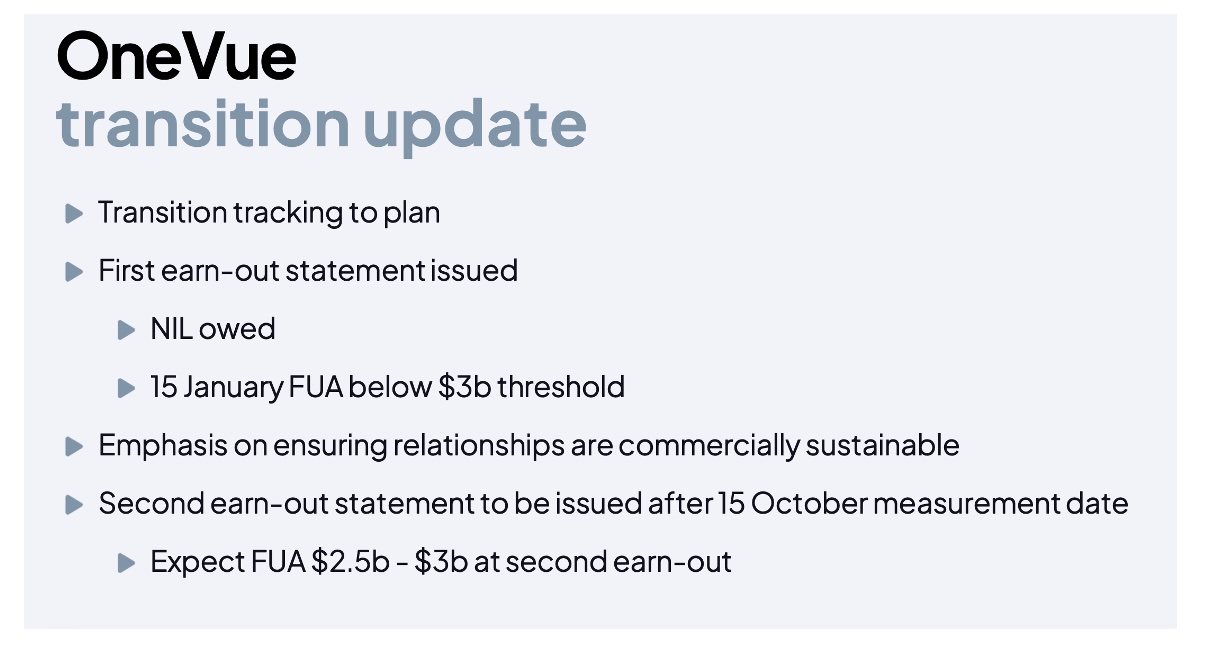
A recent acquisition at PPS was that of the OneVue platform from Iress in February 2024.
The deal was structured primarily on a performance basis, with $1m cash up front and the remaining consideration based on FUA over an 18-month period following completion.
The key point to highlight is that PPS management stated at the time of the acquisition they expect $3m of synergies and mid-teens EPS accretion. They reaffirmed this at the half year.
In the 1H25 results, OneVue was running at a -$1m run rate earnings contribution. Management stated that full synergies will be achieved in FY26, meaning there is a +$4m positive earnings delta coming in the next 18 months.
This impact will see PPS EBITDA margins lift considerably from 1H25 levels, which we think the market is underappreciating, towards the 35-40% management target.
Valuing Praemium & Near-Term Tailwinds
PPS has publicly stated their ambitions to generate consistent double digit annual revenue growth, driven by a combination of overall market expansion and continuing market share growth. They have a very long track record of having done both.
Similarly, management have stated their ambition for EBITDA margins to lift towards 35-40%, with OneVue synergies being a big contributor to that goal in the very short term.
PPS is covered by several brokers and is a relatively simple business to analyse, so it is not difficult to make forecasts around earnings. The below provides a snapshot of ‘consensus’ expectations for PPS at time of publishing.
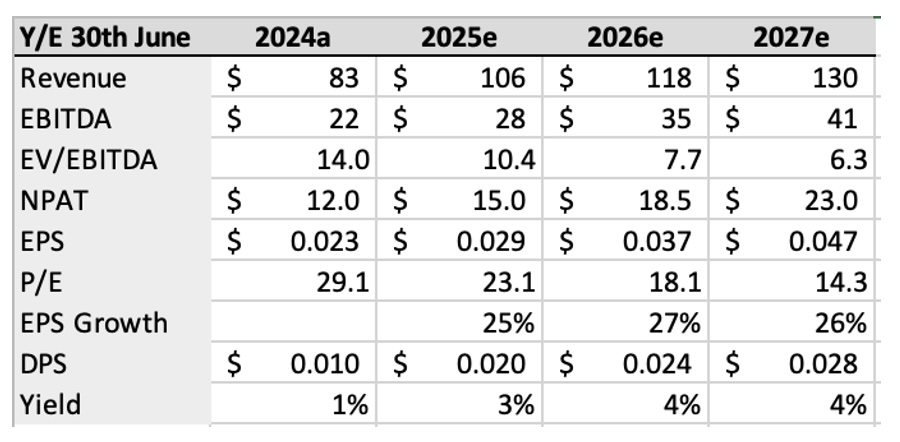
Trading on 10x forward EV/EBITDA, with EPS growth rates >20% for several years, PPS looks attractively priced to us on absolute terms.
We’ve touched on the long-term prospects for PPS, but there are several shorter-term tailwinds expected to benefit earnings.
In the Scope/Scope+ business, PPS recently put through price increases as of 1st January 2025, which will benefit the 2H25 and provide a full contribution in FY26. Price increases in the SMA product were phased in recently too.
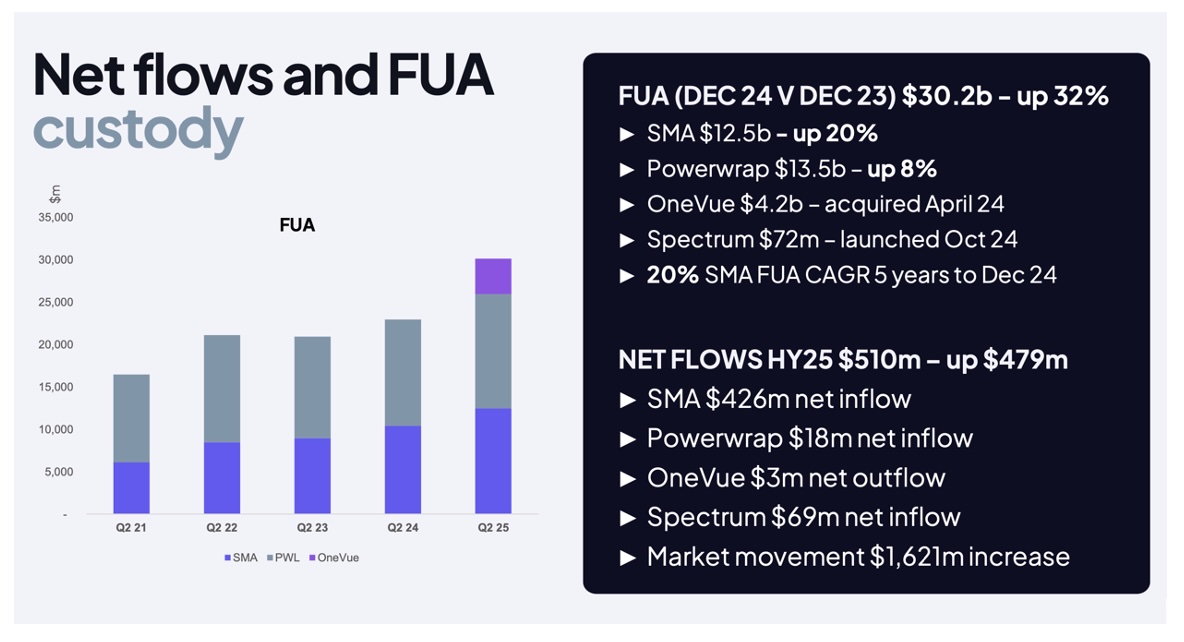
As discussed earlier, the business has recently returned to net flows and the release of Spectrum has shown early signs of optimism while opening a broader pool of potential FUA to the business.
The return to net flows will refocus the market on the long-term growth outlook for PPS.
In earnings calls, management have been about as optimistic about the future as we’ve ever heard them. This is supported by recent director buying, particularly the CEO.
Dividends have resumed (1cps in 1H25) and management expect additional regulatory capital to be freed up in the near to medium term allowing increased returns to shareholders or capacity for acquisitions (which we see as particularly interesting for the Scope/Scope+ business).
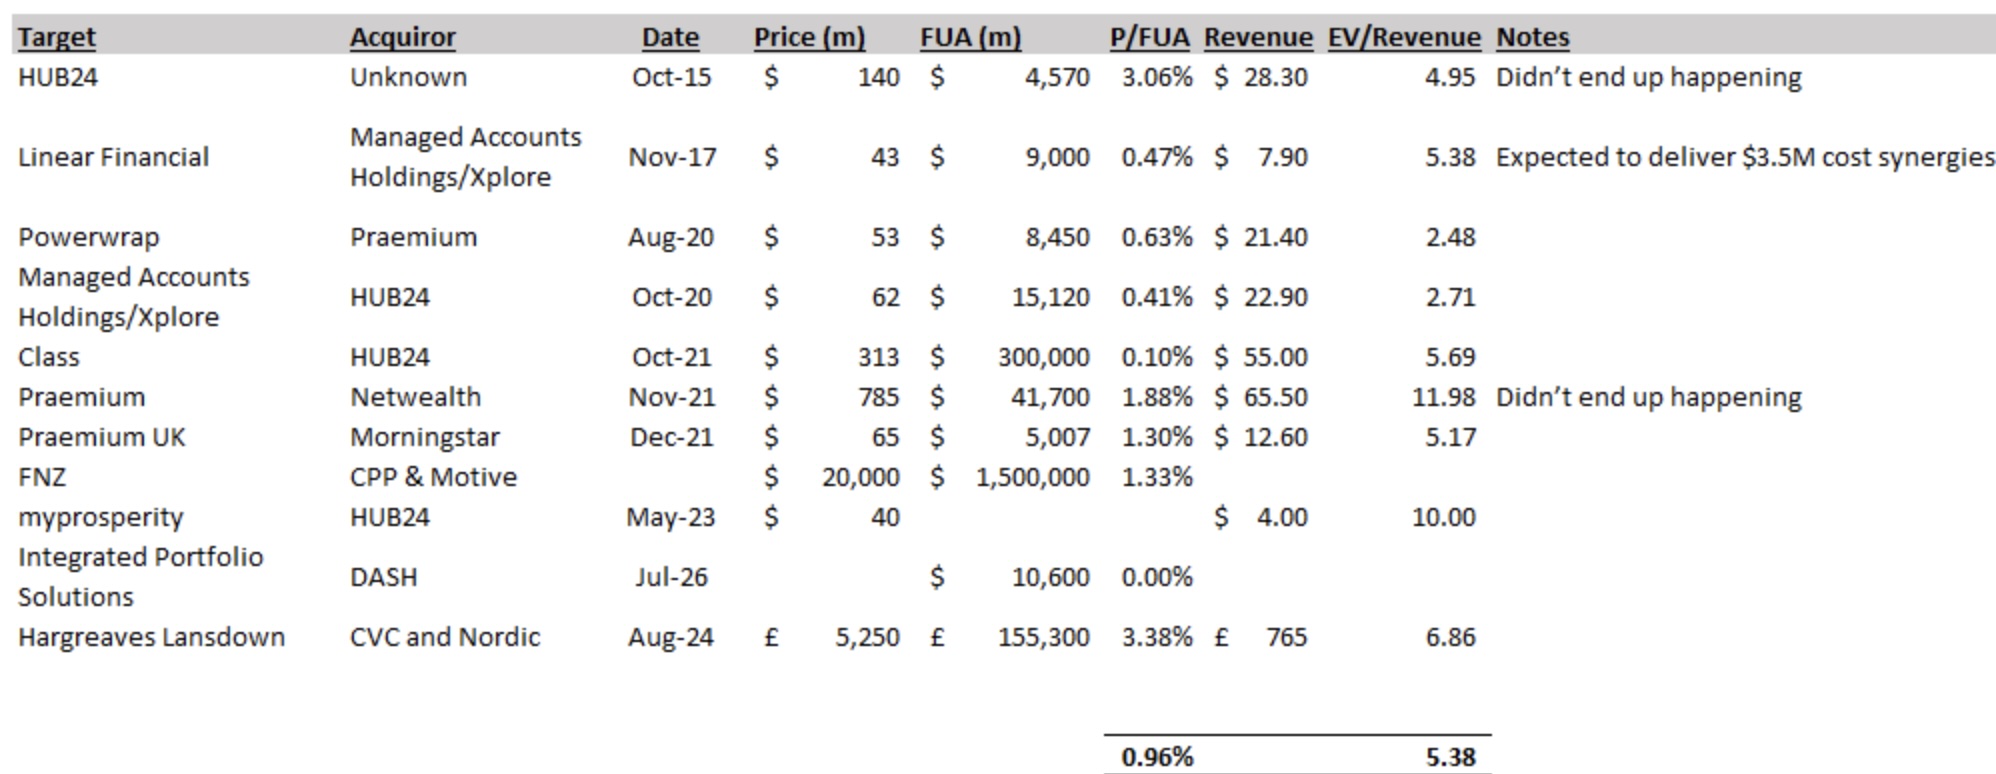
Meanwhile, consolidation in the space continues. NWL made a play to acquire PPS (via NBIO) back in 2021 valuing the business at $1.50, but it didn’t eventuate.
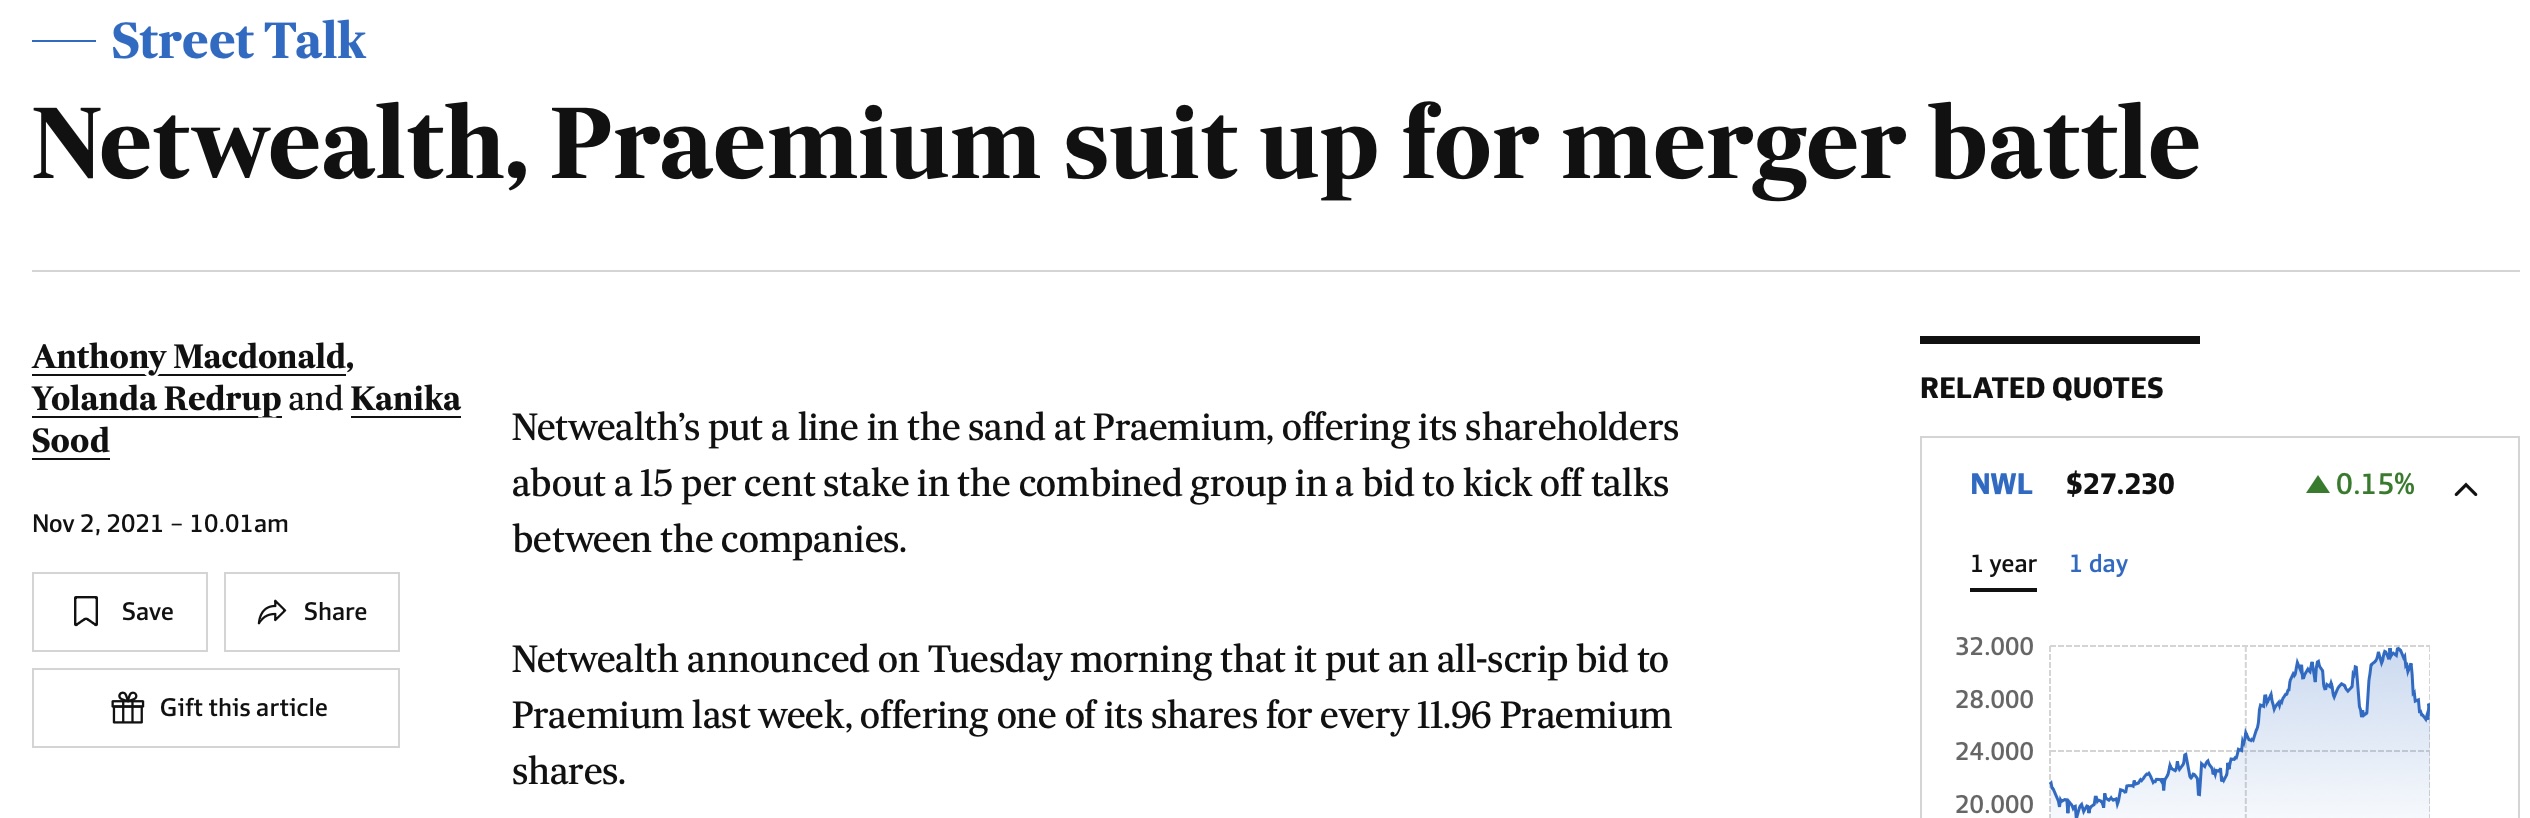
There remains the possibility they could try again, but it is just as likely that another operator (legacy or private equity) could take an interest. Netwealth itself has said M&A in the space is coming.
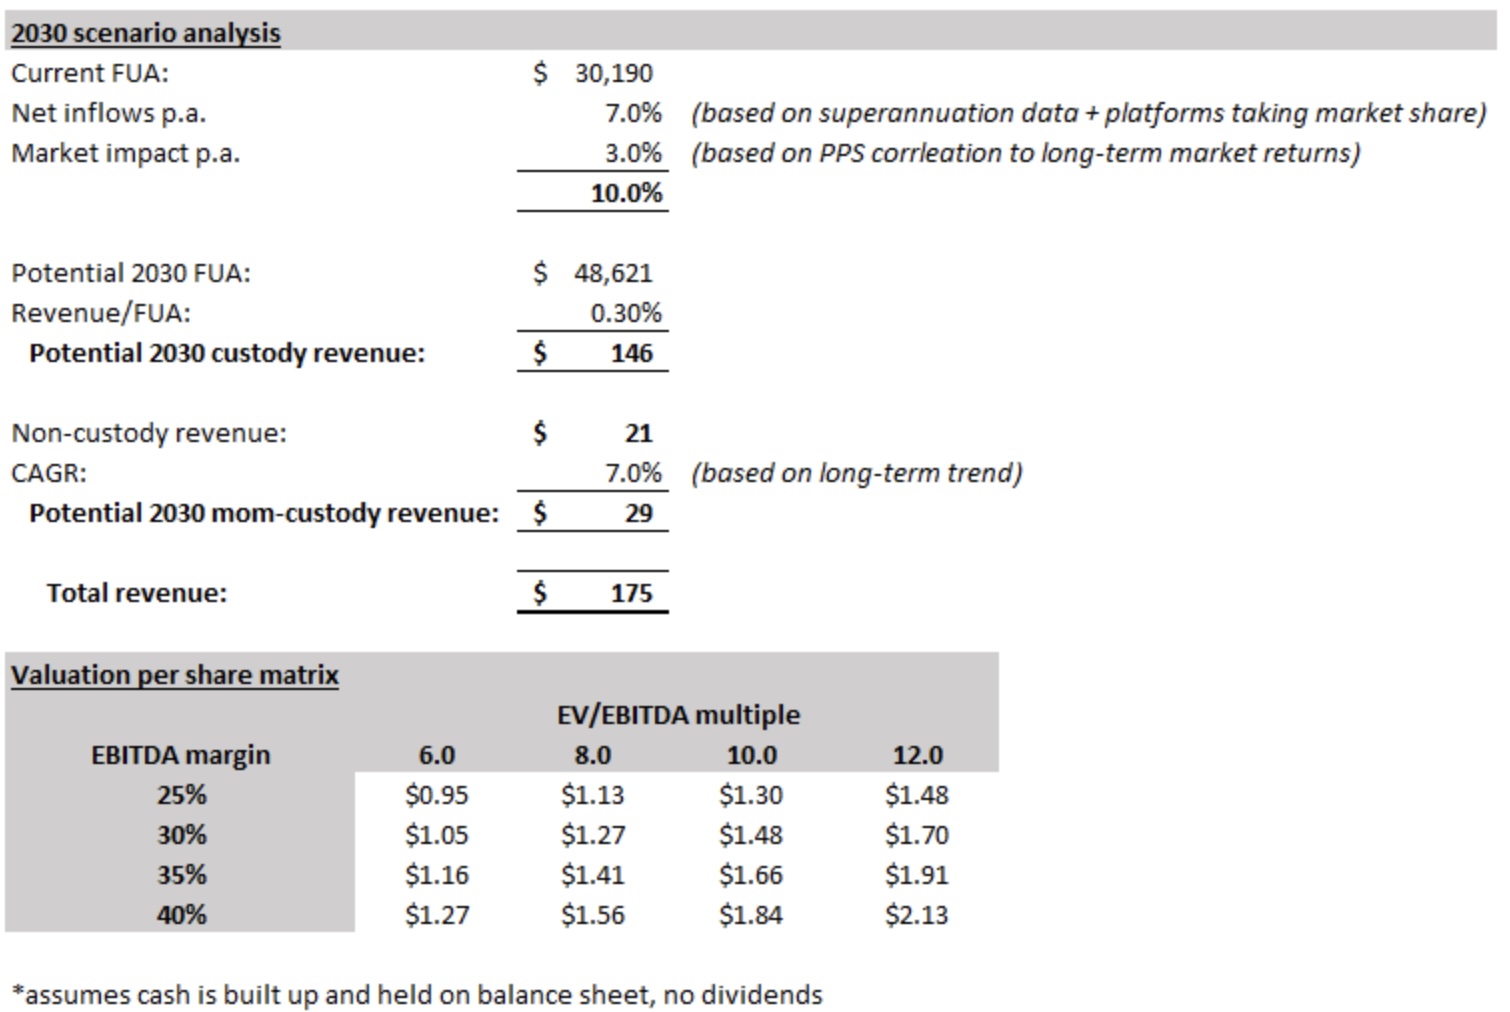
Should PPS become a takeover target once again, the market will quickly see how undervalued it is based on recent transaction multiples (see below) which imply that PPS would comfortably be worth $1+ per share.
A takeover would provide a very nice sugar hit in the short-term but our preference is for PPS to remain listed and continue to compound. Finding good businesses at cheap prices with growth outlooks you can have confidence in is hard, and having them taken out of your hands early might feel good in the short term but isn’t conducive to long term returns.
Our valuation and return expectations are based on taking a long-term view and PPS remaining listed. Our conviction is based on the overall market growth and PPS’s proven ability to gradually take share, while the business model and economics provide confidence that margins and earnings should grow strongly over the next few years.
While several near-term catalysts should support the share price in the near term, we share our longer term view in the table below.
PPS is the largest holding in Inception Fund and, we hope, will continue to be for some time.
Never miss an update
Enjoy this wire? Hit the ‘like’ button to let us know.
Stay up to date with my current content by
following me below and you’ll be notified every time I post a wire
Co-founder of HD Capital Partners and founder of Capital H Management. Portfolio Manager of the Capital H Inception Fund.
Previously worked for Pie Funds and Bligh Capital.
........
The author owns shares in PPS via the HD Capital Inception Fund.
5 topics
10 stocks mentioned

HD Capital Partners
Co-founder of HD Capital Partners and founder of Capital H Management. Portfolio Manager of the Capital H Inception Fund. Previously worked for Pie Funds and Bligh Capital.
Expertise
HD Capital Partners
Co-founder of HD Capital Partners and founder of Capital H Management. Portfolio Manager of the Capital H Inception Fund. Previously worked for Pie Funds and Bligh Capital.
Expertise
Comments
Comments
Sign In or Join Free to comment