Active-extension, 130/30... What does it all mean (and how can investors benefit)
In Australia, for decades, the conventional route to market-beating returns has been concentrated equity portfolios, often focussed on certain styles, sectors, or themes. But over the past few years many high-profile managers have come unstuck, underperforming the benchmark by 10%, 20%, or even 30%. Is there a better way?
You might have seen the term active-extension, complemented by a ratio (such as 130/30 or 150/50) associated with an investment strategy.
I can’t blame you if you’ve ignored this lingo, or just dismissed this as just industry jargon!
So, as a the portfolio manager of a 150/50 active-extension fund, I thought I'd outline what it all means in (hopefully) a way all investor can understand.
Feel free to leave a question in the comments section if you want to clarify anything.

The active-extension difference
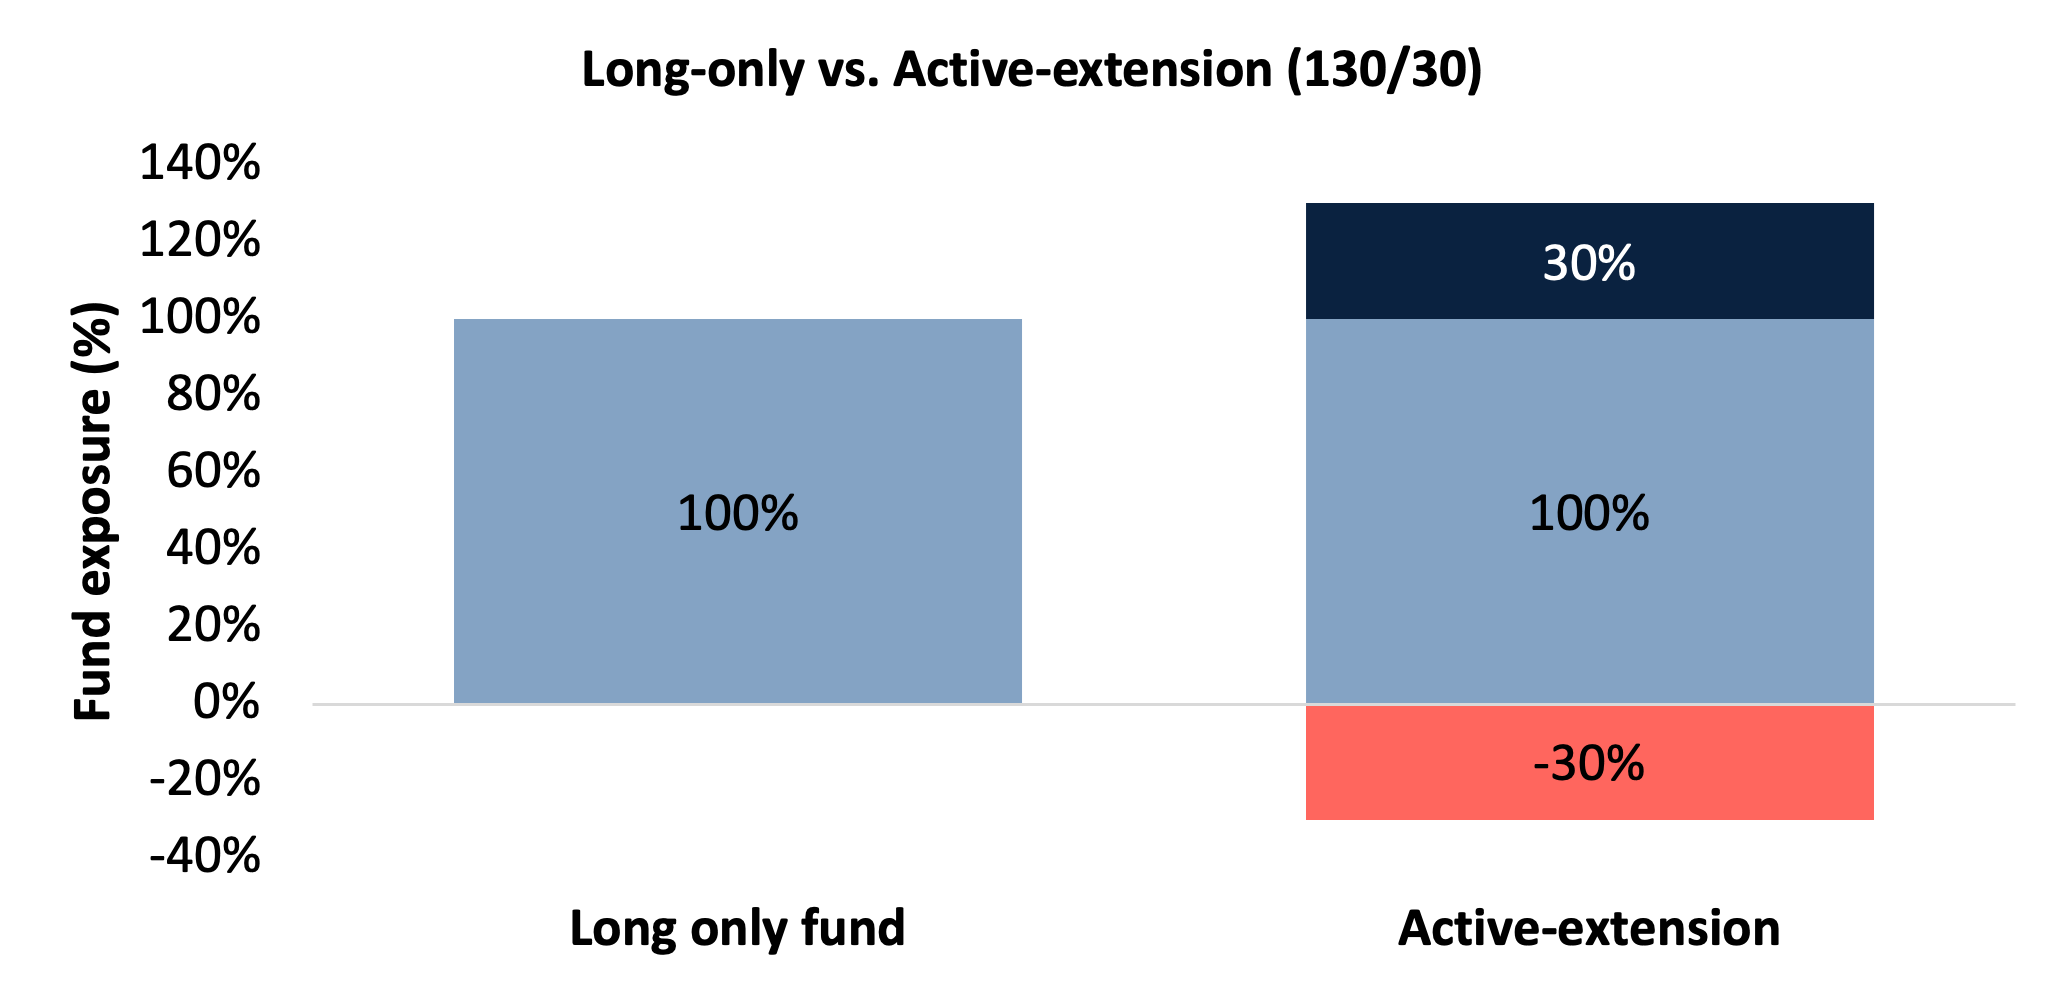
Active-extension funds are usually represented by a ratio.
If your investment manager says they run an active-extension 130/30 fund, this mean their portfolio is often 130% in long positions and 30% in short position.
How is the long book more than 100%?
If you have $100 invested in a portfolio of stocks in an active-extension 130/30 fund, there would be $30 allocated to short positions, which actually generates $30 through short selling. This $30 is then invested in an additional $30 of long positions.
Hence, 130 (long)/30 (short).
Just like a long-only equity fund, an active-extension fund has 100% net exposure to the market and will rise and fall with equities.
The active-extension advantage
The key advantage of a 130/30 fund is that it amplifies the opportunities for a fund manager to generate returns.
The manager has 30% more firepower to invest in his or her best opportunities. They also have the ability to generate alpha by going short companies they manager expects to underperform.
When a long-only manger finds a company that they are convinced will underperform, maybe the balance sheet is overstretched, or the accounts have been manipulated, all they can do is not hold the name (underweight the name relative to the benchmark). Because most stocks have a tiny weight in the benchmark, this makes a tiny difference to their benchmark relative performance.
For example, in the ASX 300 there are just twenty stocks that make up more than 1% of the benchmark. In the MSCI World the problem is more acute still, with just seven of the 1500 stocks with a weight of more than 1%.
So, even if a long-only manager has uncovered an outright fraud, they are generally powerless to turn that information into meaningful alpha for their clients.
What does the evidence say?
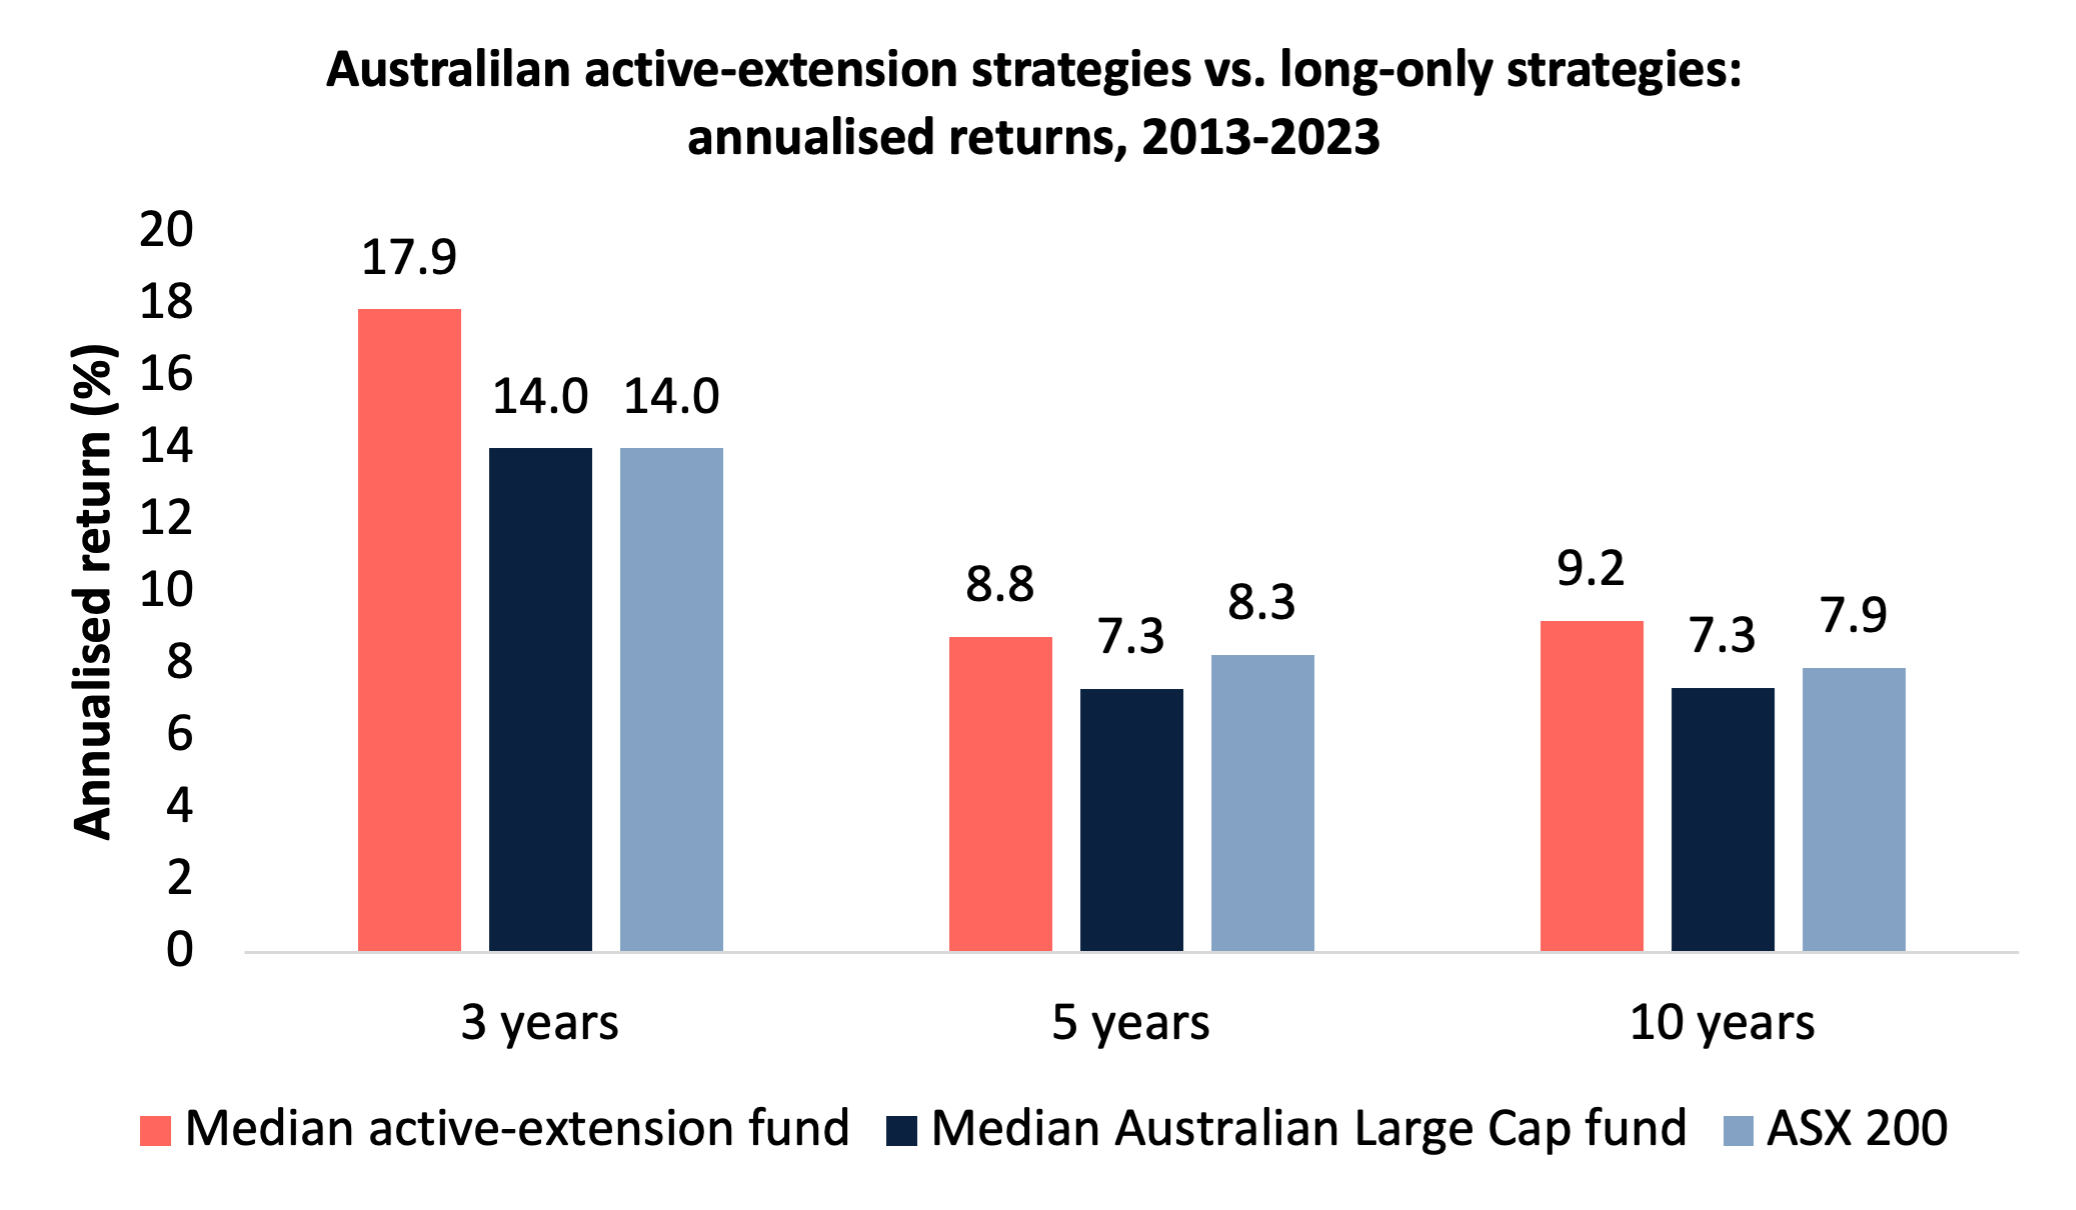
Using Morningstar data for the period 2013-2023, we compare the performance of Australian active-extension funds to traditional long-only funds. We include dead funds to avoid survivorship bias.
Australia has a small number of active-extension strategies, several with FUM of close to a billion dollars. The number of active-extension funds that existed over the time period is 31 compared to 674 long-only funds, so the sample size of active extension funds is not huge.
With that caveat in mind, we can see that the median active-extension fund significantly outperformed the median long-only fund over three, five, and ten years. Over the last three years the annualised performance difference is almost 4%. So the evidence we have suggests that if you want to generate market-beating returns the active-extension structure is a better mousetrap.
If your main focus is income however, active extension is a poor choice due to shorting costs that detract from income.
Source: Plato Investment Management, Morningstar data, Joshua Campbell
The outlook for short-enabled strategies
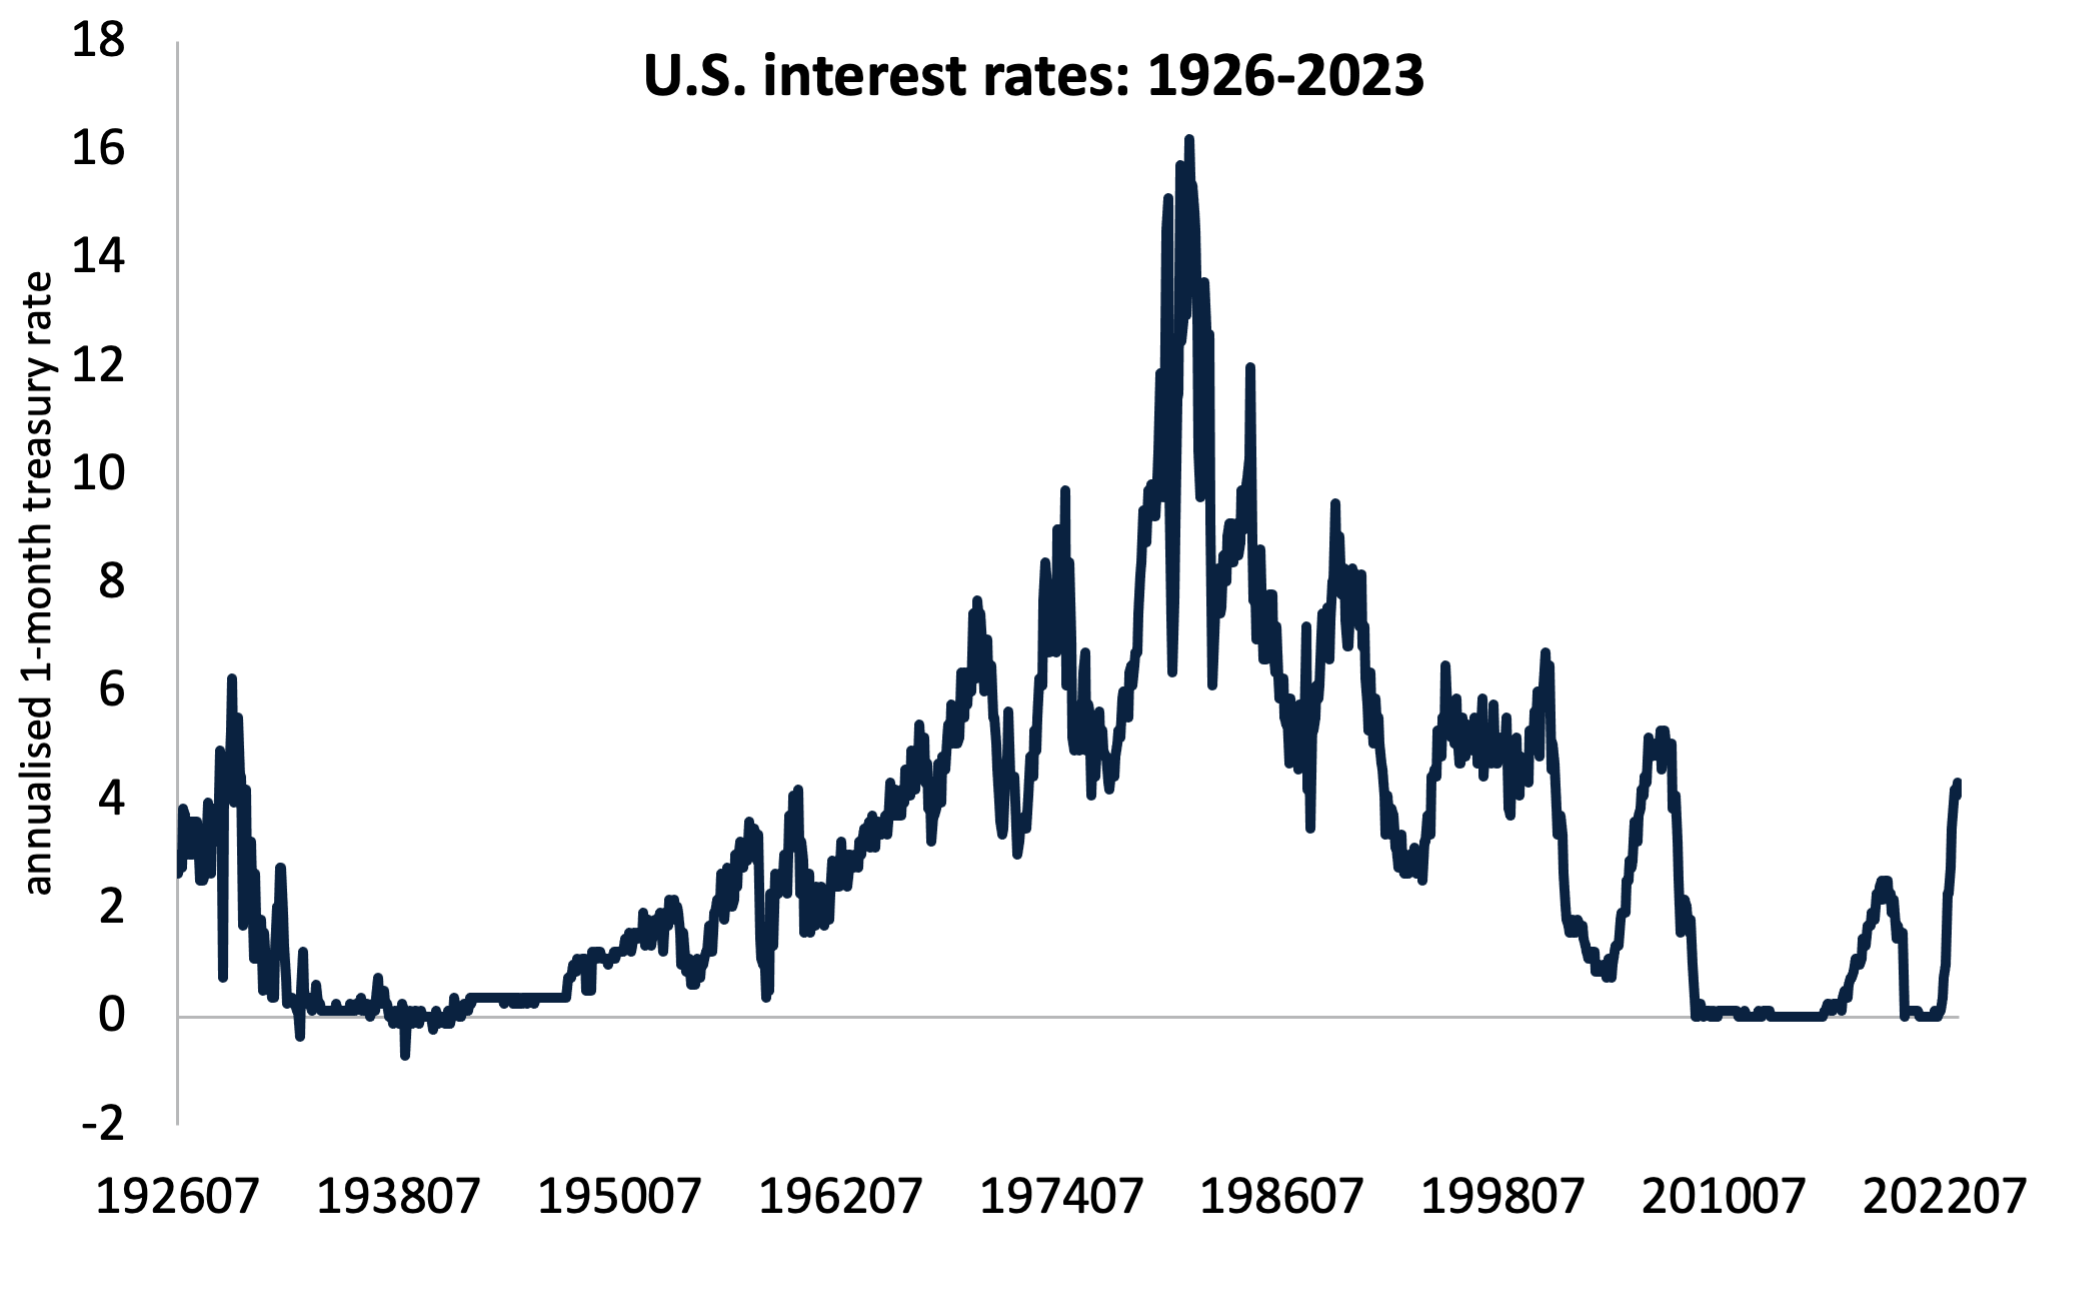
The ultra-low interest rates of the past decade has few precedents over the past 200 years.
Not since the aftermath of the Great Depression, when unemployment in the U.S. reached 25%, have we seen interest rates so low for so long.
This has inflated the prices of everything from NFTs, cryptocurrencies, and profitless tech companies.
Source: data courtesy of Kenneth French
What is unprecedented is the speed at which the Fed has hiked rates, applying a blowtorch to the valuations of speculative companies.
The chart below is from a Livewire article I wrote in May. It shows the staggering proportion of companies with negative operating cashflow i.e. their everyday activities are losing money before even accounting for interest payments, capex or dividends.
Australia has the highest proportion of companies with negative cashflow. That does not mean we are bearish on Australia, quite the contrary. It just means investors need to be discerning.
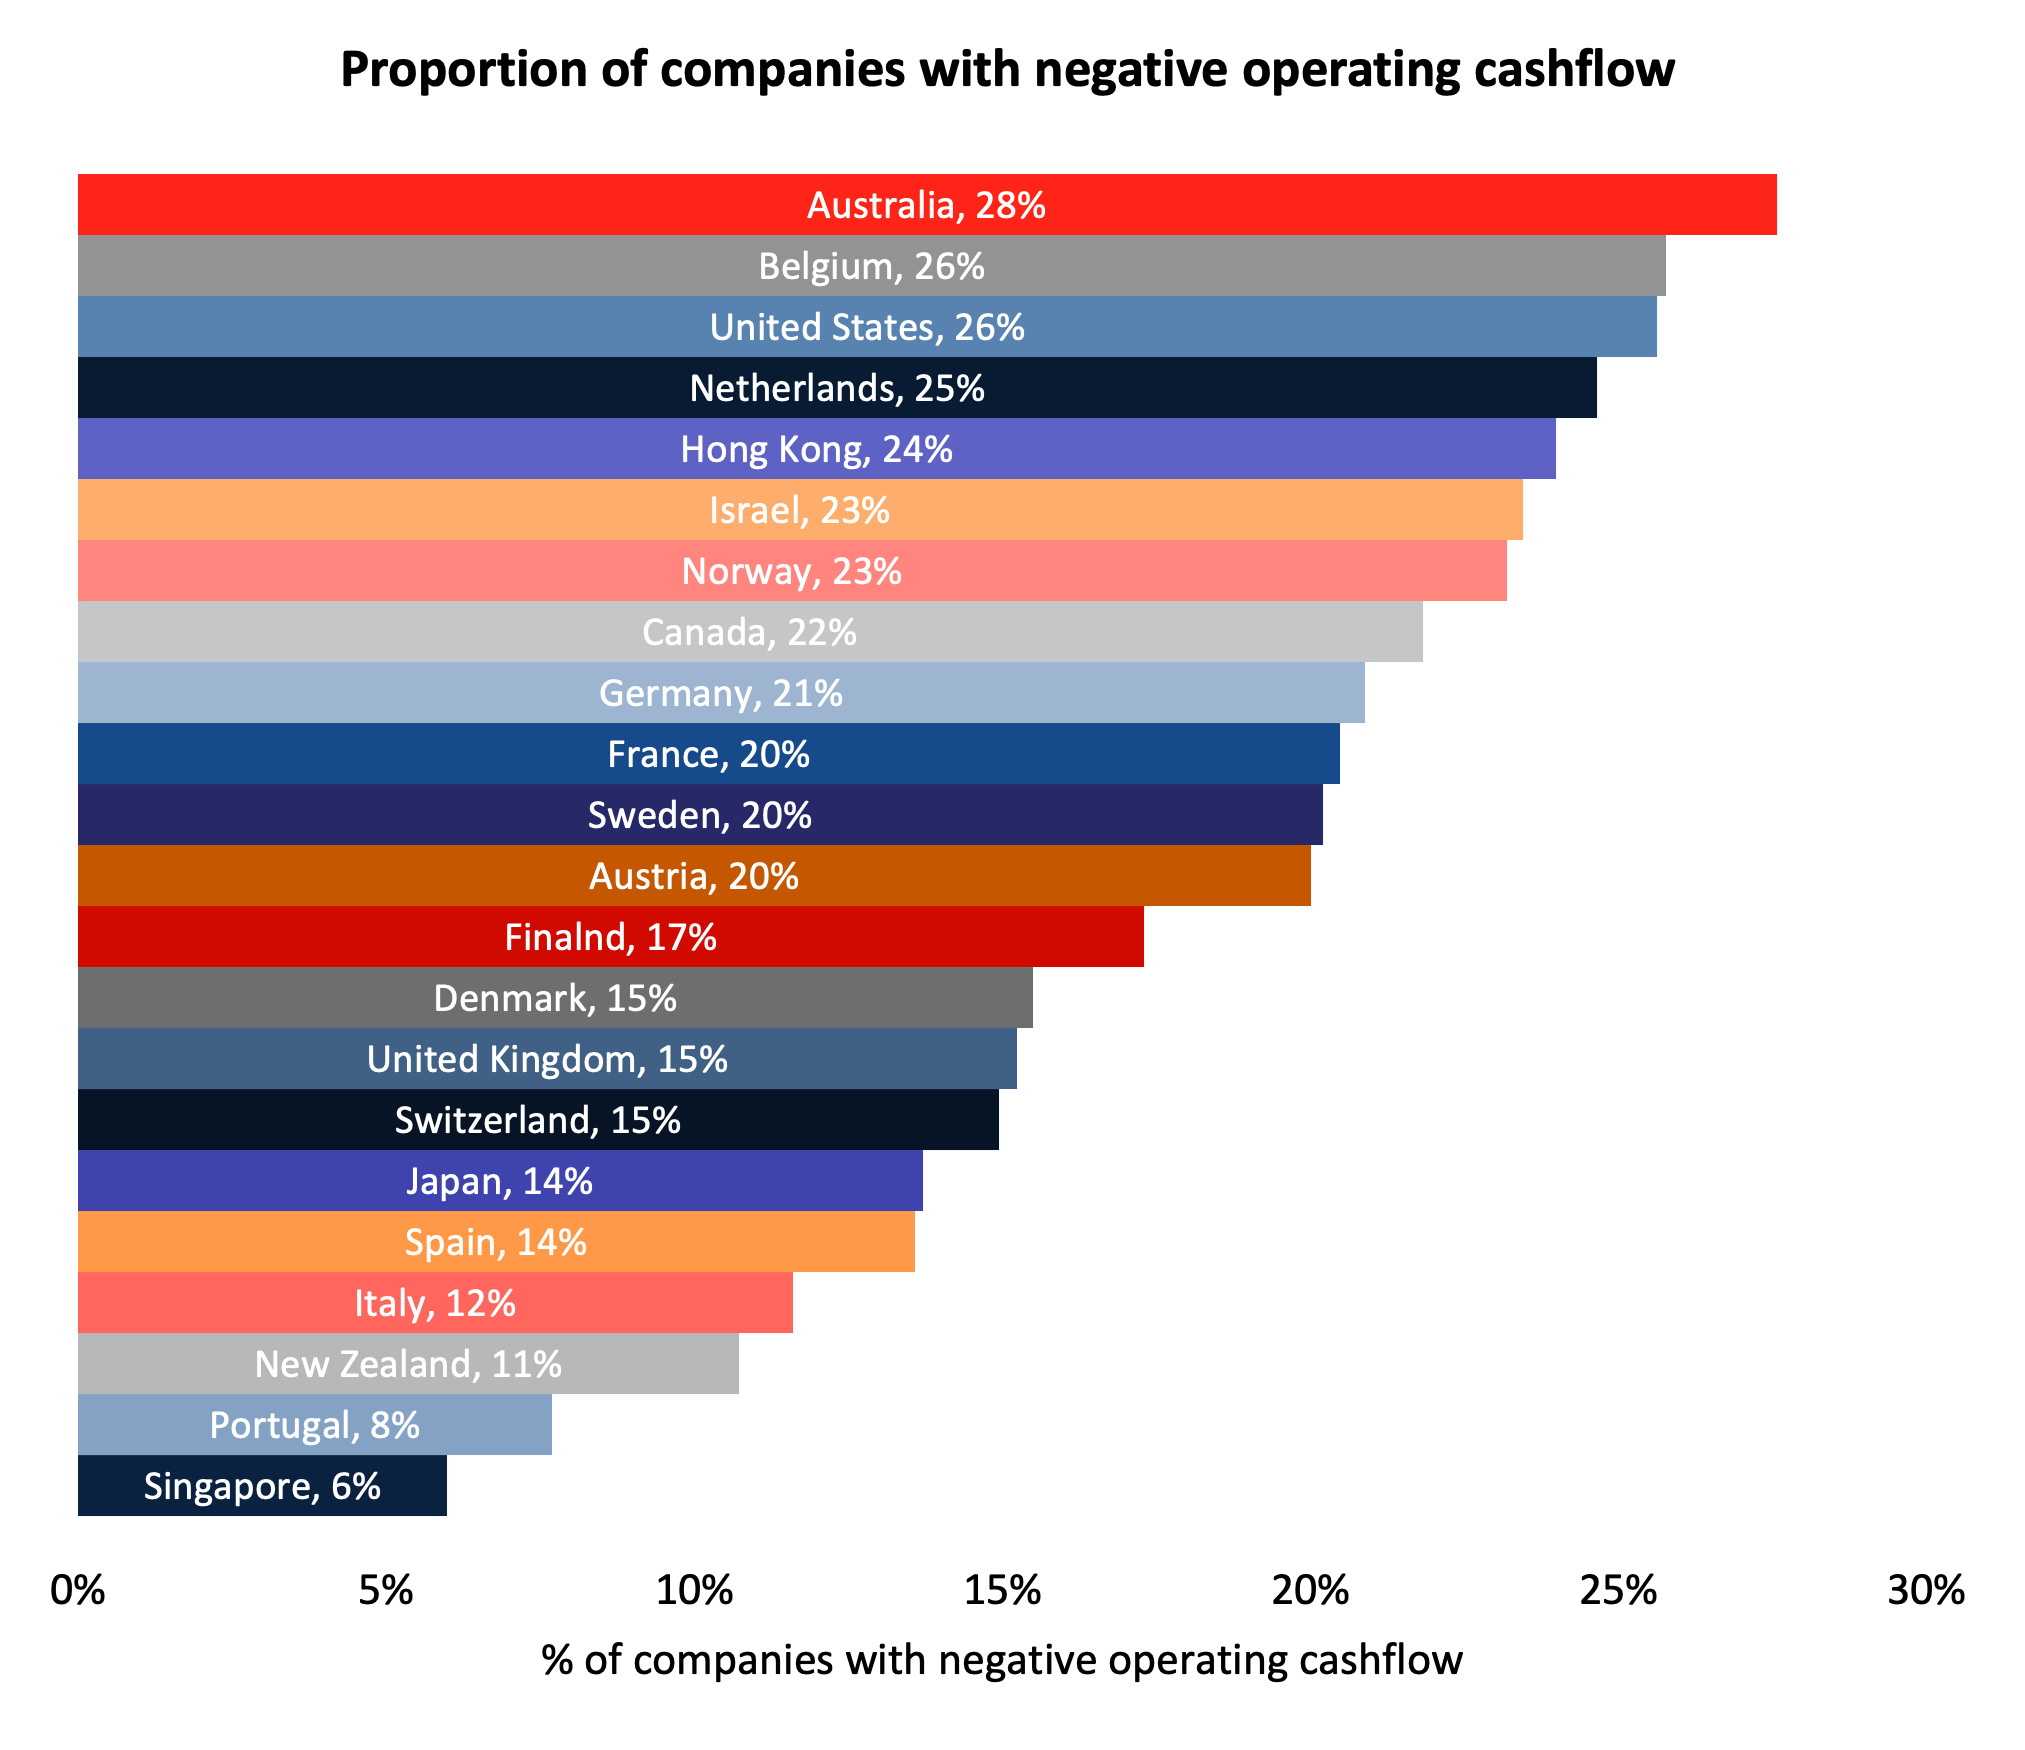
The net result is a very attractive environment for short-enabled strategies. As an aside, most of the alpha generated by the Plato Global Alpha active-extension strategy has been from the short side.
Learn more about the Plato Global Alpha Fund
The Plato Global Alpha Fund aims to deliver investors an all-weather investment solution. The Fund was recently named in the Australian Financial Review and Livewire Markets as one of the best performing global equities funds during FY23.
1 fund mentioned
