Broken dreams: How long it really takes to save for a 20% house deposit in 2024
It is the ultimate barbecue topic - or as I prefer to think of it, the ultimate sausage topic. Sausages are, for someone like me at least, delicious, unhealthy, and yet an irresistible option at a potluck table. And while this analogy might be a stretch, you could think of our national obsession with housing in the same way. It's unhealthy how much we all talk about house prices, yet it's an irresistible topic of conversation because most of us will have to confront the realities of owning a home at some point.
And much like the cost of purchasing barbecue essentials in 2024, the Australian housing market is also utterly absurd.
More suburbs than ever now attract a median dwelling price of greater than $1 million and the total quoted value of residential dwellings has nearly doubled in the last decade to $11 trillion. For some perspective, the value of house prices is 6.25 times nominal GDP in Australia.
And while it is true that owning your own home is the most important and most consequential financial decision you can make (yes Mum and Dad, I hear you), it is also true that the cost of purchasing this life essential is now out of reach for so many Australians - not just first time home buyers anymore.
In this series, we're going to ask a very simple question: How broken is Australia's housing market?
To do so, we have to break this meaty topic into three wires. This first will focus on how difficult it has become to own, or save for a house deposit, in Australia. Subsequent wires will discuss who should foot the blame for the housing crisis and whether residential property is really the best investment a person can still make.
But we start with the hard numbers and the cold charts - and for this, we call on the services of CoreLogic's Eliza Owen as well as the charts of AMP Deputy Chief Economist and Signal or Noise's very own Diana Mousina.

- The median dwelling value to income ratio is 7.9.
- Our home price-to-index ratio has increased from 3x in the mid-1980s to 9.6x today.
- It would take almost 11 years for the median income household to save a 20% deposit for the median dwelling value in Australia. This number has nearly tripled since 1984.
- The portion of income required to service a new mortgage on the median dwelling value is now half the median gross household income.
- Home ownership, while still high by global standards, has steadily declined since 1995.
What is the median dwelling value to income ratio and why does it matter?
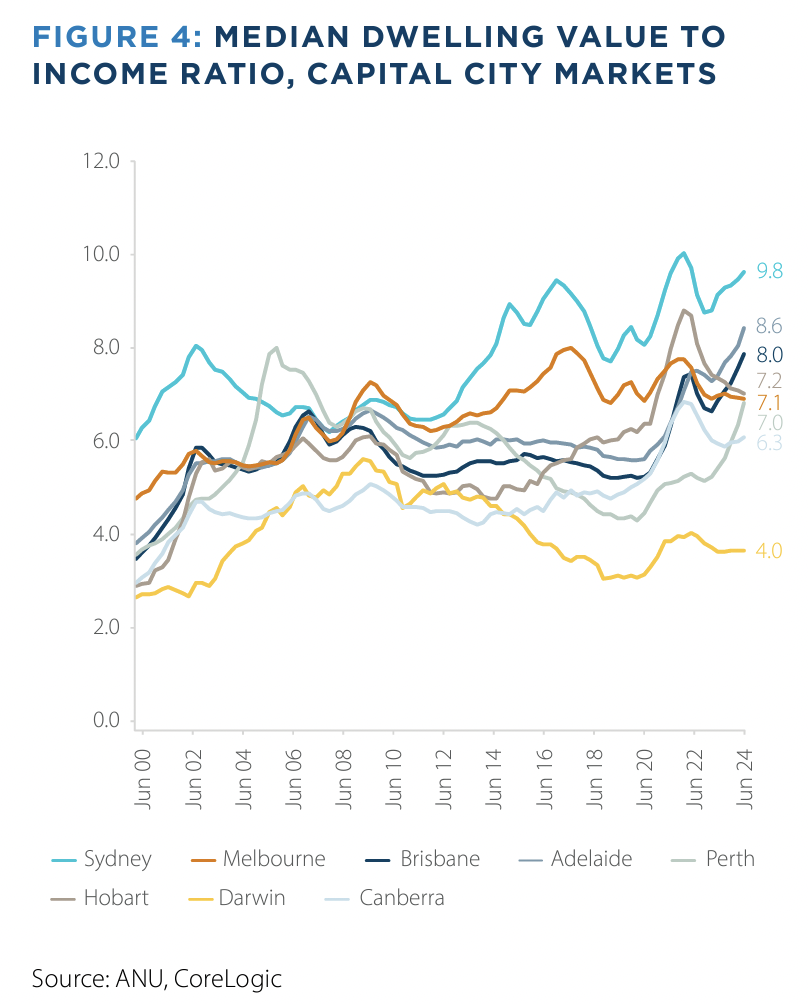
Let's start with the median dwelling value to income ratio. The first chart below shows this ratio as broken down by state capital city. You get no prizes for guessing which city that top line belongs to.

Price-to-income ratios are often used in isolation to assess how easily a typical household can purchase a typical dwelling (provided there are no surprise changes.) This ratio also explains why it takes a salary of over $200,000 to comfortably afford to live in Sydney and nearly $160,000 to do the same in Melbourne. And it also shows:
"This suggests the median gross household income estimate (about $100,000 per annum) goes into the median dwelling value almost eight times. This is a near-record high and is above a decade average of 6.7," explains Owen.
Australia also ranks highly among our peers when it comes to the home price-to-index ratio. Since the mid-1980s, this figure has tripled. And unlike our peers in the US, New Zealand, Canada and Germany, Australia's figure... just keeps going up.

Why is the capacity to pay falling?
Linked to this is the collapse in the "capacity to pay" measure - which is an unofficial look at the capacity for a borrower to pay their 20% deposit and then continue to pay off their mortgage provided they make at least the national average pre-tax salary ($100,000) and keep it to a reasonable percentage of their income (most finance experts say this is around 30%.)
This measure rose steadily until 2020 when COVID hit. But unlike the capacity to pay measure, house prices kept going up - exacerbating the crisis even further.
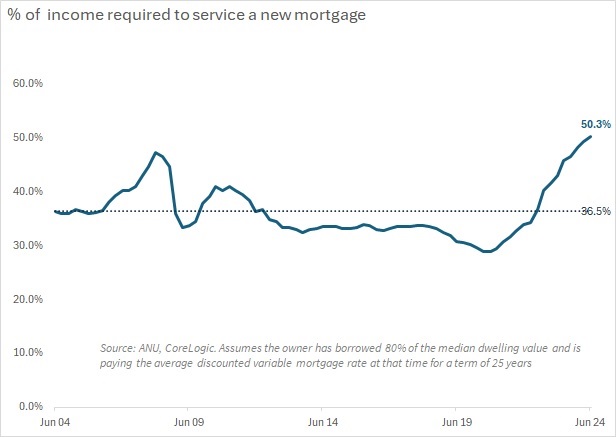
Add to this statistic the following number: the portion of income required to service a new mortgage on the median dwelling value is now 50.3% of the median gross household income, up from a decade average of 36.5%.

And while it's not necessarily realistic, "it is still illustrative of how far off a typical income household is from being able to purchase a typical dwelling based on income and savings alone," says Owen.
How long does it take to save for a 20% home deposit?
The next statistic is my personal favourite. Not just because there are now advertisements for neo-banks promising they can lend a first time home buyer the huge amount of cash needed for a mortgage with just a 2% deposit, but also because this chart answers the claims of other Australians who say that young people have an easier economic environment now than they did "back in the day."
This chart shows that the number of years it takes to save for a 20% deposit has nearly tripled over the past 40 years. And to make matters worse, this number may actually be a lot higher in reality, as Owen explains:
"This assumes an annual savings rate of 15%, which might be a challenge anyway given current cost of living pressures," Owen says.

What is Australia's homeownership rate?
If Australia's housing market isn't broken, then explain to me why home ownership has been in steady decline for decades. Data from the 2021 Census show a homeownership rate of 67%, down from 70% in 2006 and well down from their peak levels in the 1960s.

But where the story really lies is in the breakdown by age group. The home-ownership rate of 30–34-year-olds was 64% in 1971. It is now, according to the Australian Institute of Health and Welfare, just 50%. And that rate is falling for all age cohorts, as the following GIF shows:

"If housing was affordable and accessible to our growing population, you’d have to imagine the rate of home ownership would be steadier over time," Owen says.
This concludes Part 1 of the Housing Market series. In Part 2, we'll discuss who is to blame for the housing crisis as it stands today and why there might be some hope for those who want to see prices come down. The answers are more nuanced than you might expect.
2 topics
1 contributor mentioned

