TOL - 14th Mar, 2025
Is the ASX 200 about to crash? Lessons from 50 years of stock market crashes and calamities
The next stock market crash and bear market may have already started. This is how you can tell, and therefore protect your portfolio.
Yesterday, we explored the reasons for the ASX 200’s rocky start to 2025, pondering whether the market’s current wobble could be a harbinger of impending doom. This article is all about context – to make sense of today’s turbulence, let’s take a walk down memory lane – revisiting the most famous and devastating stock market crashes and bear markets of the past 50 years.
This journey might be painful for some, stirring memories of lost fortunes and shattered confidence, but it’s a necessary one. As the saying goes: Those who fail to learn from the mistakes of the past are doomed to repeat them.
With an investing career that started in the early 1990s, it took me until the GFC to properly learn from past market downturns and come up with what I believe is a robust set of technical analysis signals consistent with most major market calamities. Yes, that took a long time – but I trust that by showing you what I have learned – I can make your journey to being able to spot the next major market downturn far quicker.
Here we go, 50 years of stock market crashes and calamities!
1973 Oil Crisis Bear Market
Between May 1970 and January 1973, the S&P 500 had nearly doubled and was powering ahead strongly. But, as is so often the case, out of left field came the 1973 Oil Crisis. OPEC’s oil embargo against nations supporting Israel during the Yom Kippur War sent oil prices skyrocketing, quadrupling in just a few months.
This supply shock crippled economies, triggering stagflation – i.e., high inflation paired with stagnant growth (hmmm, what’s happening now? 🤔). Geopolitical tensions amplified the panic, as investors feared prolonged instability.
Stock markets, including the ASX and S&P 500, tanked, as corporate profits withered under rising costs and falling demand. From January 1973 to October 1974, the S&P 500 shed nearly 50%, while the ASX suffered similar carnage.
This crash taught a harsh lesson that we’ll see repeated throughout this investigation: External shocks can expose underlying weaknesses, turning a boom into a bust almost overnight.

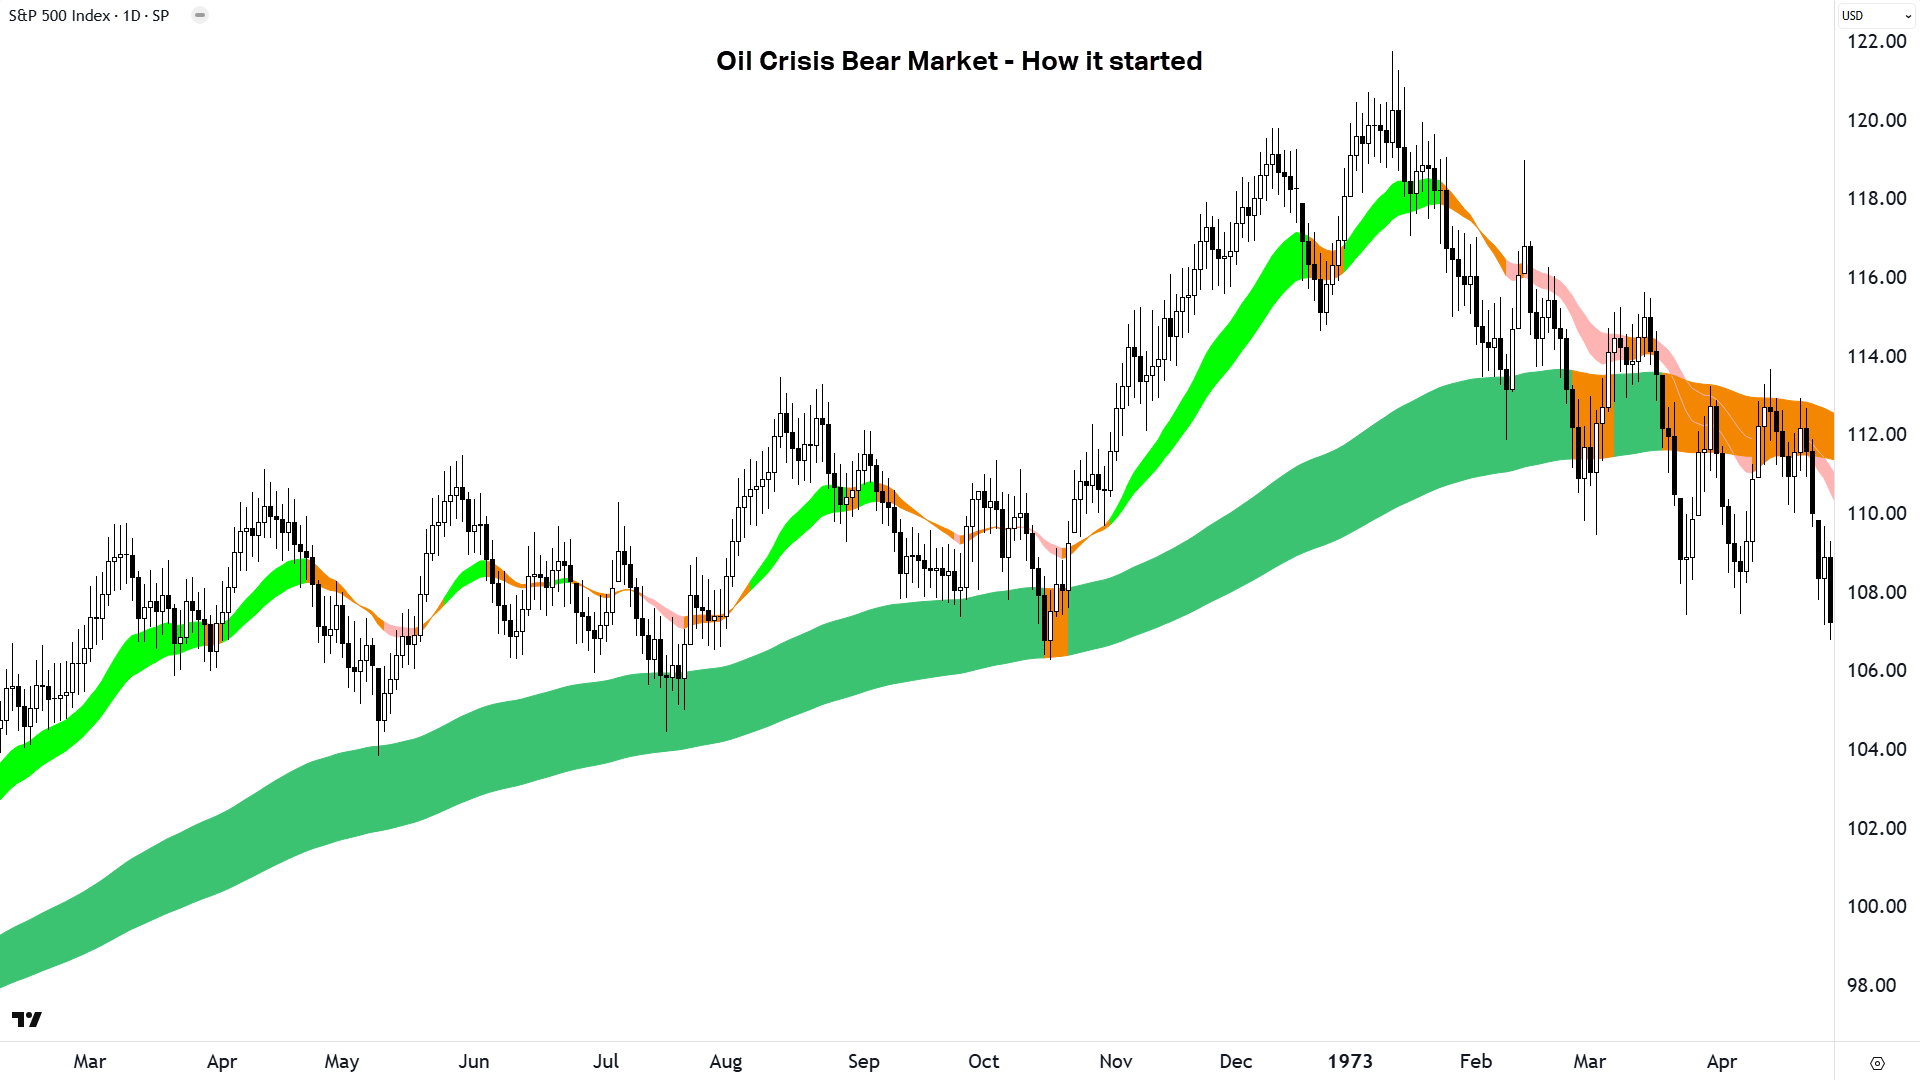
From a technical perspective, the Oil Crisis Bear Market started much the same way as most of the crashes we will investigate – with rising short and long term trends (my light green and dark green trend ribbons). But as we will see, there are several technical analysis traits consistent with long term trend change. They are:
Short term uptrend ribbon (light green) transitions to a neutral trend (amber), then a short term downtrend (light pink).
The price action transitions from rising peaks (i.e., supply removal) and rising troughs (i.e., demand reinforcement), to falling peaks (i.e., supply reinforcement) and falling troughs (i.e., demand removal).
The candles transition from predominantly demand-side in nature (i.e., black-bodied and or with downward pointing shadows) to predominantly supply-side in nature (i.e., white-bodied and or with upward pointing shadows).
The long term uptrend ribbon (dark green) transitions to neutral (amber).
The long term uptrend ribbon stops acting as a zone of dynamic excess demand / support (i.e., the price action tends to bounce out of it) and begins to increasingly act as a zone of dynamic excess supply / resistance (i.e., the price tends to be repelled lower by it).
Note in the chart above how each of these technical indicators demonstrate how control of the S&P 500 price transitions from demand-side control up to January 1973, to equilibrium around February and March 1973, and then with the long term trend ribbon firmly acting as a zone of excess supply – to supply-side control by April 1973.

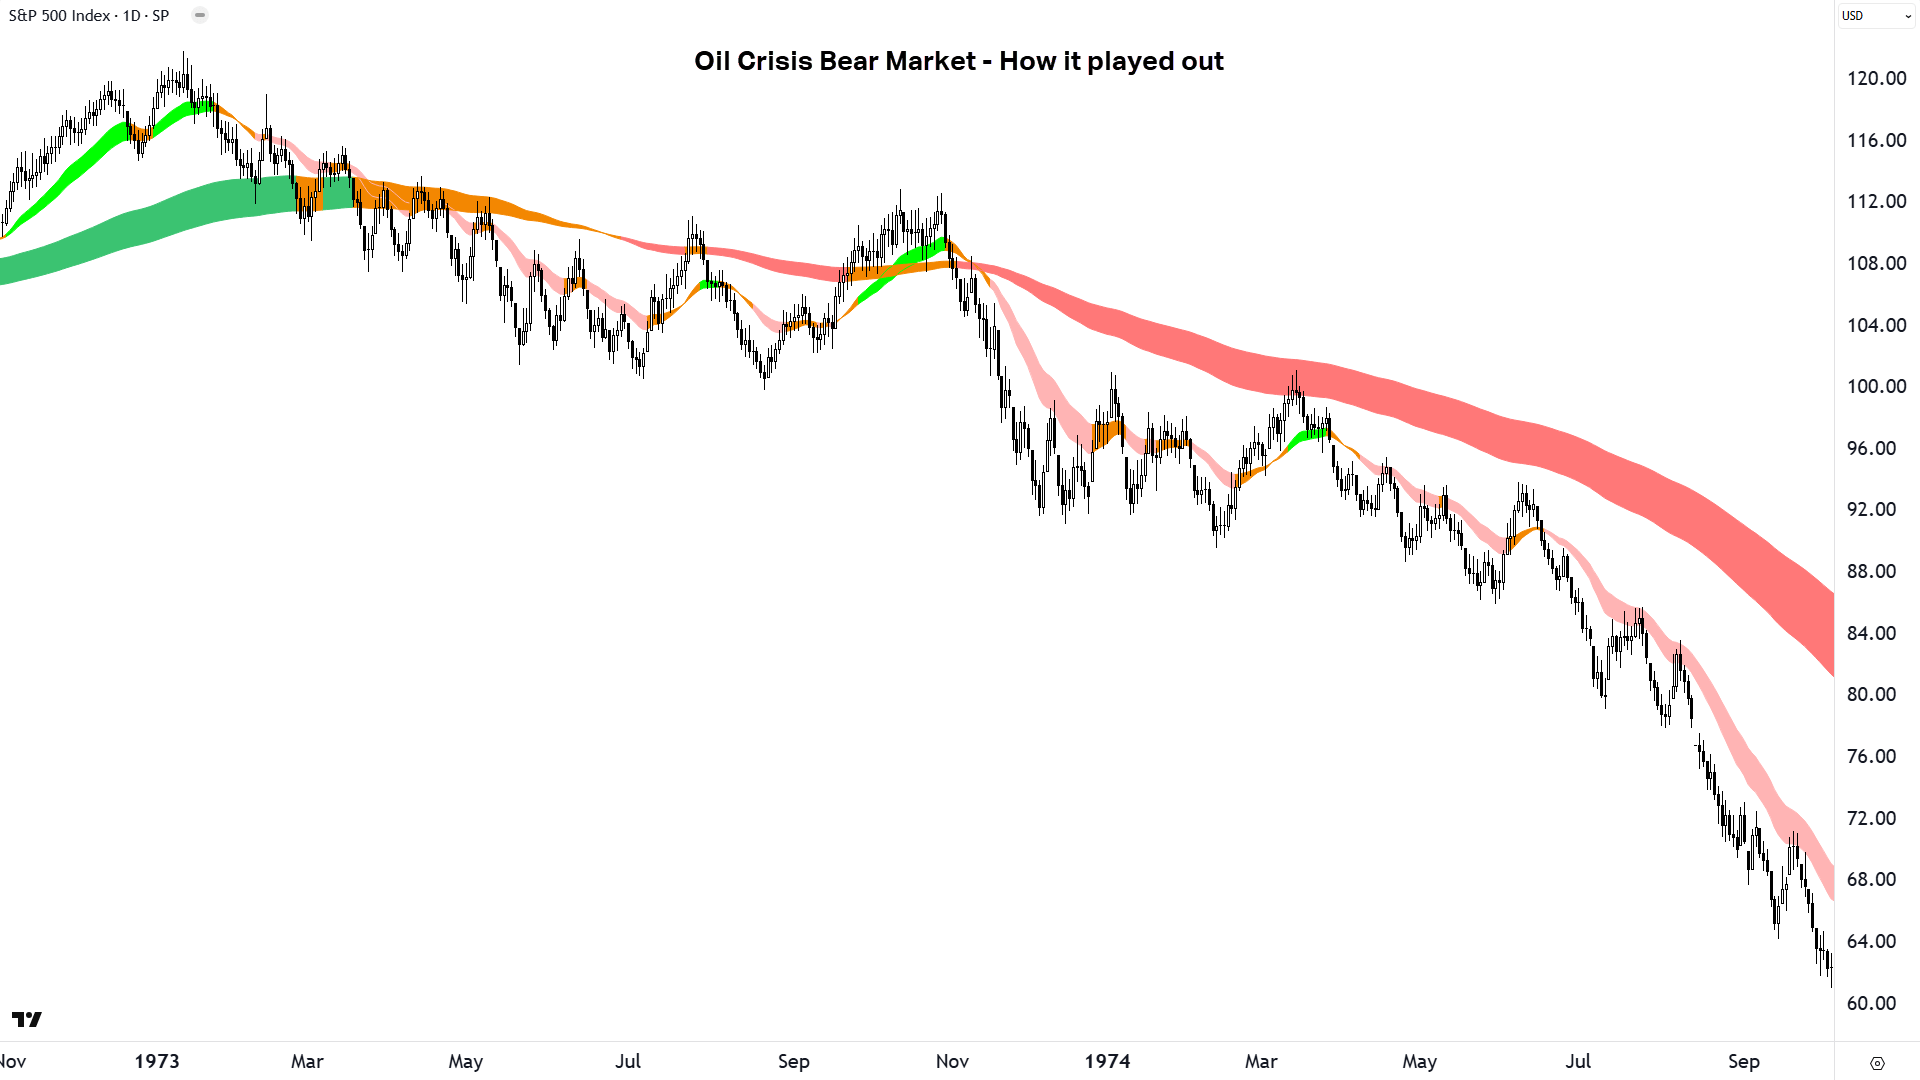
As bear markets progress, they are characterised by the following technical factors:
- Short and long term downtrend ribbons
- The short and long term downtrend ribbons act as zones of dynamic excess supply – repelling fledgling rallies
- Supply-side price action: Falling peaks and falling troughs
- A predominance of supply-side candles
1987 Stock Market Crash
Now to the big one, the Black Monday Crash that occurred on October 19, 1987 – a day of stock market infamy! The ASX 200’s predecessor, the All Ordinaries, and all major global indices plummeted – the S&P 500 dropped over 20% in a single day.
Leading up to it, arguably, was a rampant speculative bubble fuelled by easy credit and 1980’s overconfidence. Programmed trading and portfolio insurance, new at the time, exacerbated the fall as automated sell orders spewed stock into a vacuum of demand.
In short, a mix of overvaluation, margin debt, and a fragile market structure made the market ripe for a panic. No obvious major economic crisis preceded it, making the 1987 crash more of a technical collapse than an obvious fundamental one.

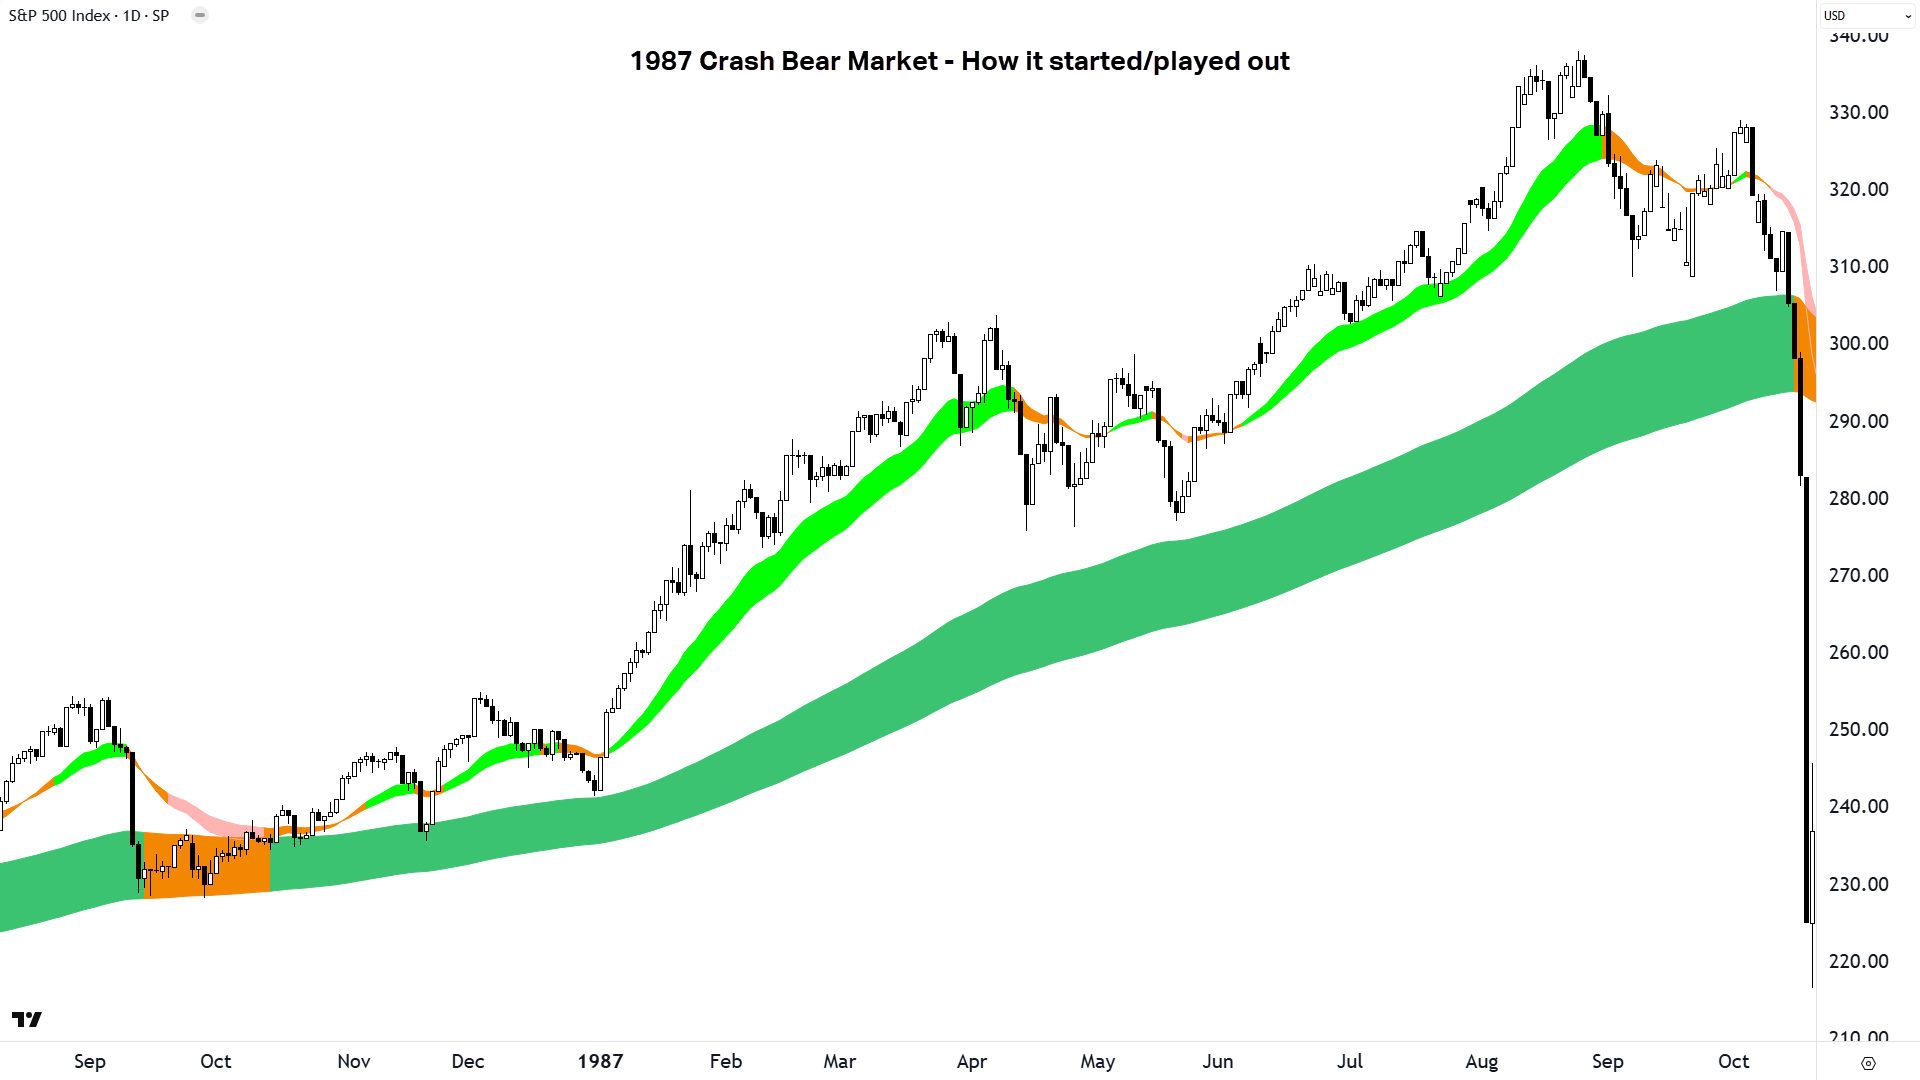
There’s only one chart this time, as the entire move from top to bottom played out in a matter of days (Note: Each “How it played out” chart shows the market peak to absolute bear market bottom move).
There were the tell-tale signs of increasing supply-side control prior to Black Monday, however, with a transition to a short term downtrend, falling peaks and falling troughs price action, an increasing predominance of supply-side candles.
What this market calamity lacks that the relatively easy ones to predict tend to have – is the hallmark long term uptrend ribbon transition from a zone of dynamic-demand to a zone of dynamic supply – through the all-important neutral phase.
Interestingly, the recovery from the 1987 Stock Market Crash was nearly as swift as the preceding calamity – a theme we will see repeated in 2020. Still, the lesson lingered: Unchecked exuberance and untested systems can unravel spectacularly!
2000 Dot-Com Crash and Bear Market
This was my second bear market, the first being the Asian Crisis of 1998. I lost a great deal in that one, and clearly had not learnt a thing from it, as two years later I lost even more in this one!
The late 1990s saw tech stocks soar as the internet promised a new economic era. Tech stocks – really anything that proposed anything to do with the internet – went bonkers. These were fun times. Buy something which had just announced it was starting an internet business in the morning and sell it for a 100% profit by the afternoon! Ka-ching! 🤑
In my now +30-years of investing experience – I can honestly say it was never so easy for someone with absolutely no investing experience to make a fortune in the market so quickly (well, until Crypto that is!). Many called it the purest exhibition of the greater fool theory since 1929.
But as is generally the case in markets – the good times eventually come to an end – and usually with a great, big thud. The bubble burst. In the 4 weeks between 10 March and 14 April 2000 the Nasdaq, a proxy for the “Dot-Com” mania as it had come to be known, fell 63%. There wasn’t a clear catalyst in terms of news or fundamentals – it just did. My theory is the market just ran out of fools.
There began a withering multi-year bear market where the Nasdaq lost over 75% from its peak in total. It dragged most broader markets, even our own ASX, into a bear phase, as billions in speculative investments evaporated and unprofitable startups collapsed into the nothingness from whence they came...
There is a silver lining to the seven-figure sum I lost in the Dot-Com bear market – I began to figure out how to invest properly. The genesis of the technical methodology I share with you today started in that bear market – as did the realisation that protecting one’s capital is far more important than trying to double it by lunchtime!

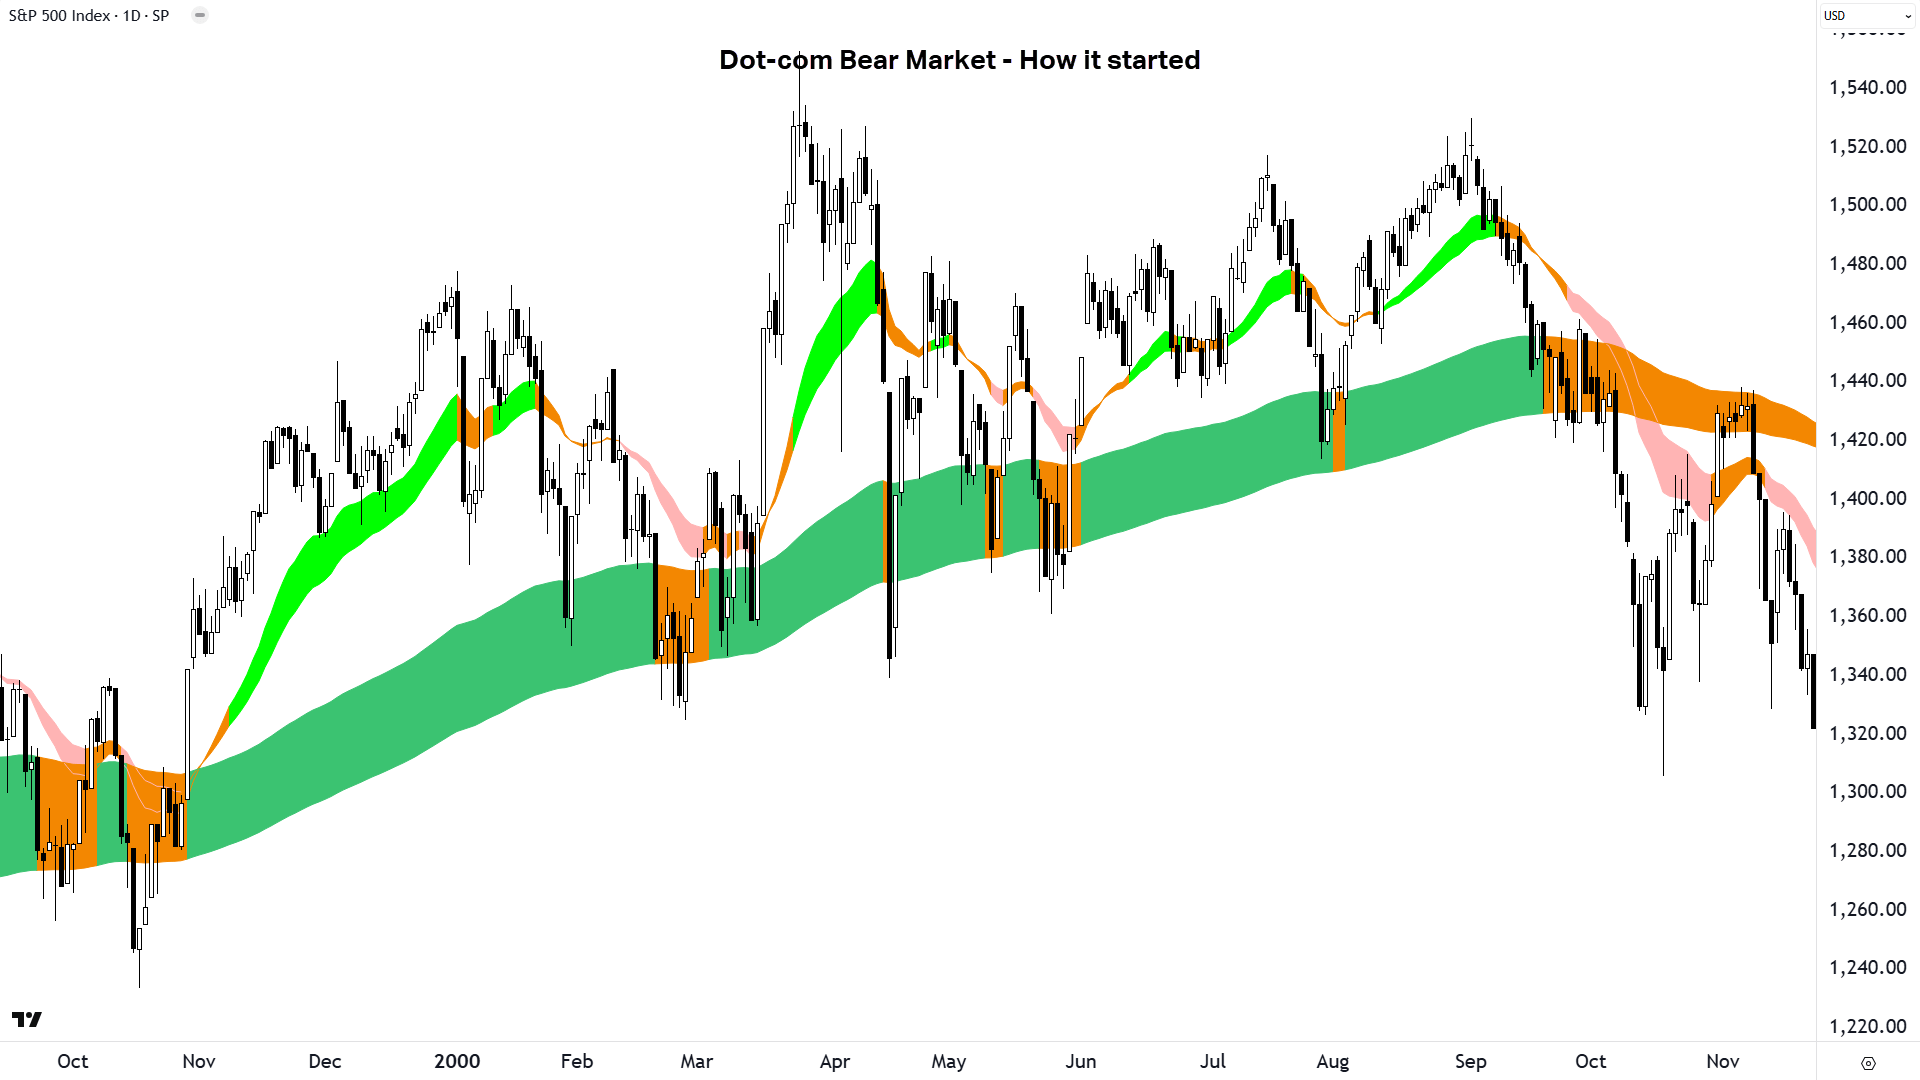
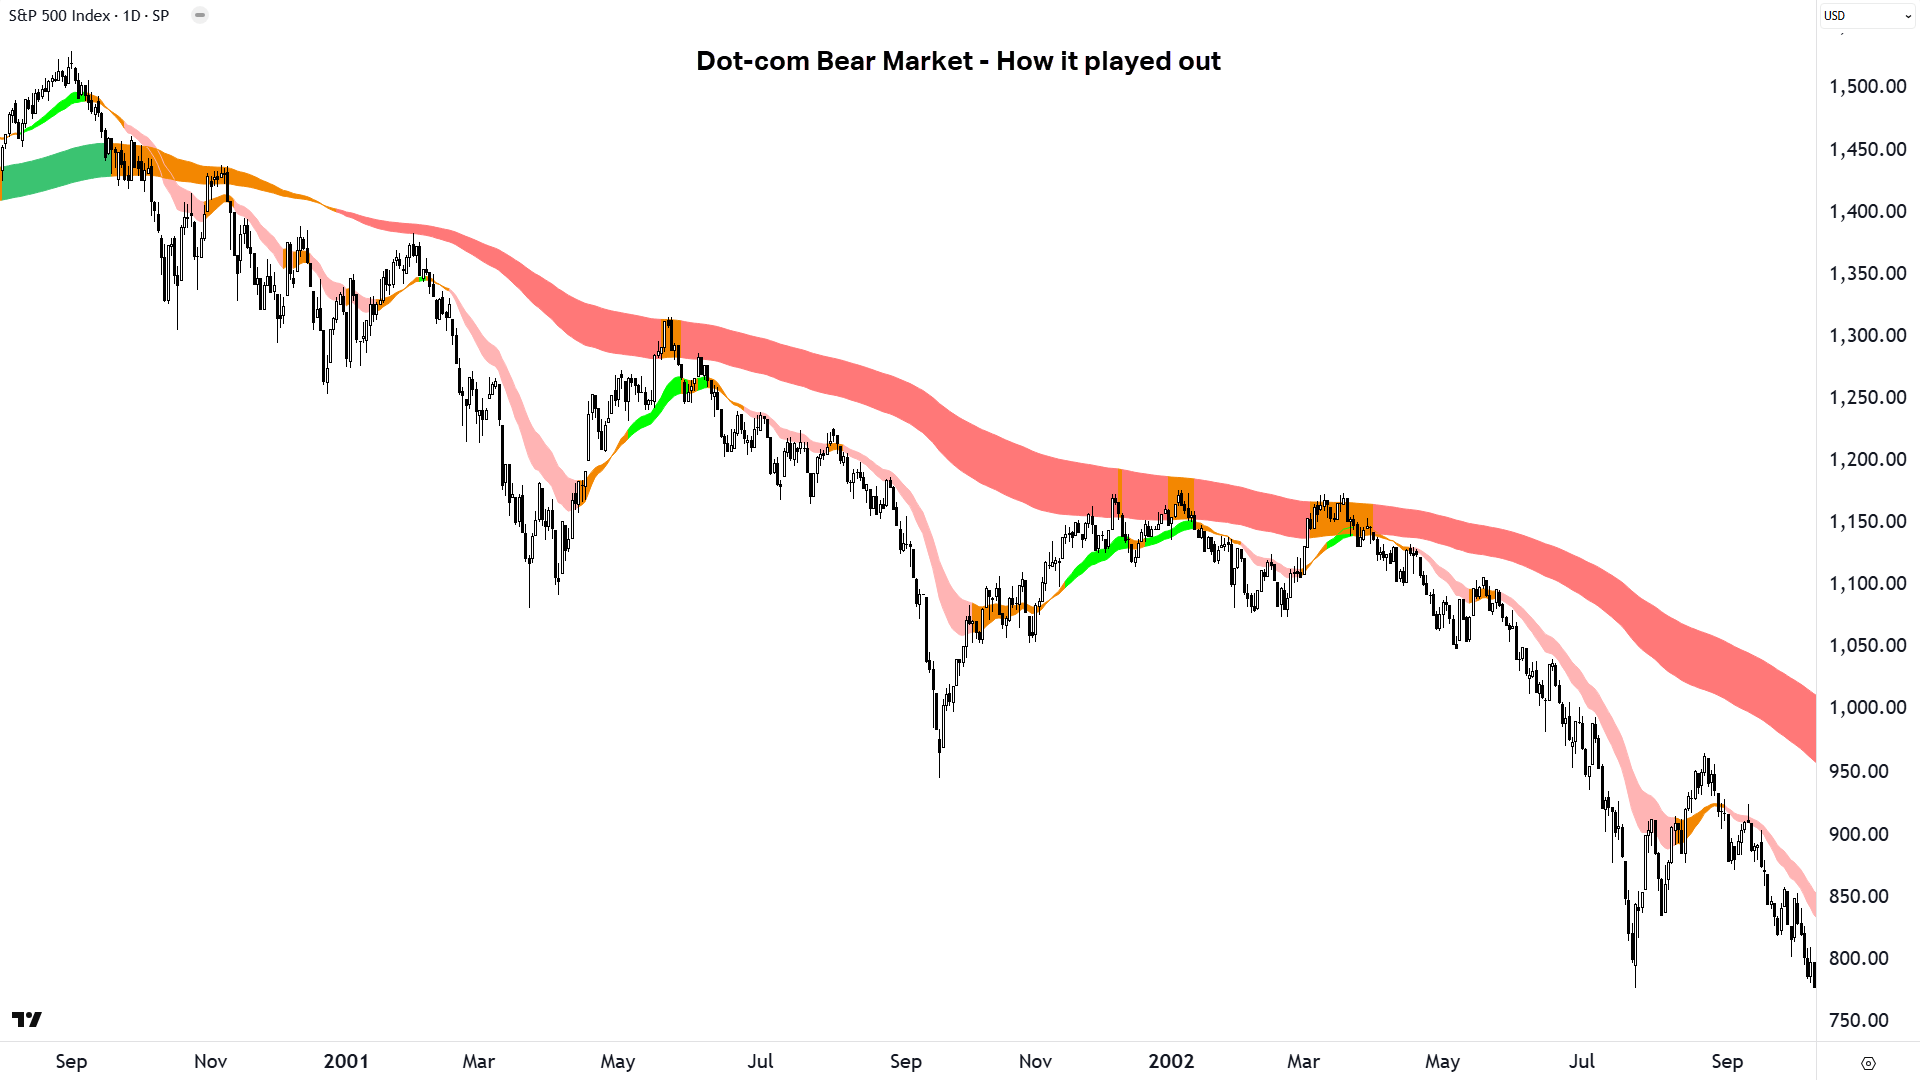
Much forehead slapping has occurred for me in the 25-odd years since this bear market. If only I knew then what I know now…Alas, I can’t turn back the clock, but I can show you how my transition to a bear market technical methodology would have worked perfectly.
The above shows the clear transition from demand-side control (long term uptrend ribbon supporting the price) through equilibrium (amber long term ribbon, closing below the long term ribbon), to supply-side control (long term uptrend now resisting the price).
As you can see from the below chart, the rest is as they say, history!

2007 Global Financial Crisis Bear Market
The 2007-2009 Global Financial Crisis (GFC) was a slow-motion train wreck. It began with the U.S. housing bubble, inflated by subprime mortgages and lax lending standards (you want to check out the movie “The Big Short” here).
When defaults spiked, complex financial instruments like mortgage-backed securities imploded, freezing credit markets. The collapse of investment bank Lehman Brothers in 2008 marked the tipping point, sparking widespread panic.
Central banks slashed rates and bailed out institutions, but trillions of dollars of wealth across the entire financial ecosystem had evaporated nearly overnight – so the recovery took years. The GFC underscored how interconnected markets amplify systemic flaws.
I managed to avoid the vast majority of the worst of this one – not because I had some innate ability to read the financial warning signs like Michael Burry did – simply because by then I had transitioned to a purely technical analysis-based investing approach. I just observed the signals I am teaching you here.
It’s also the first bear market where I learned the power of short selling – that there’s even more money to be made in a bear market by shorting than there is in a bull market by using the old BHP Technique (Buy, Hold+Hope, Pray!).

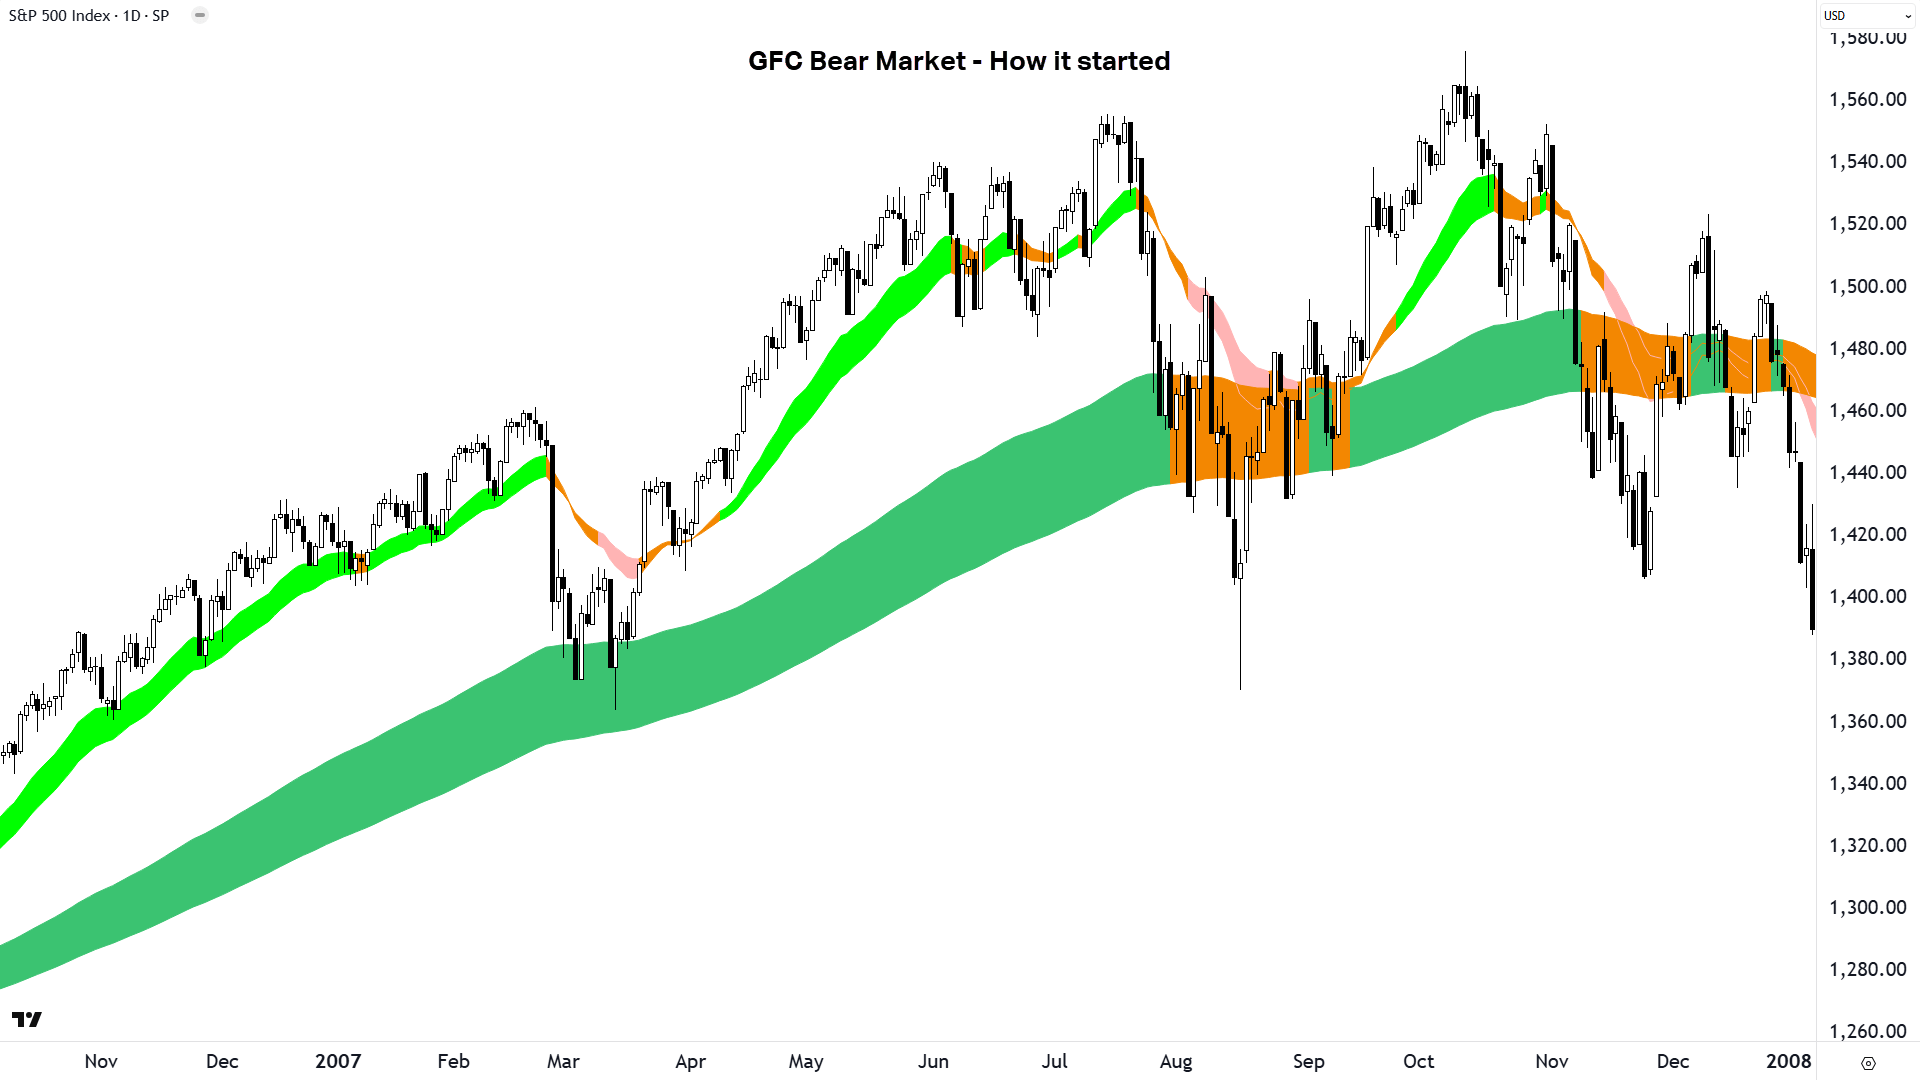
A prolonged equilibrium phase here. For many months, the supply-side distributed stock, but demand remained relatively rock-solid. Prices moved sideways in a choppy range between 1380 and 1580. This kind of volatility is consistent with market indecision about the underlying fundamentals, and hardly the kind of price action that trend traders like me want to see.
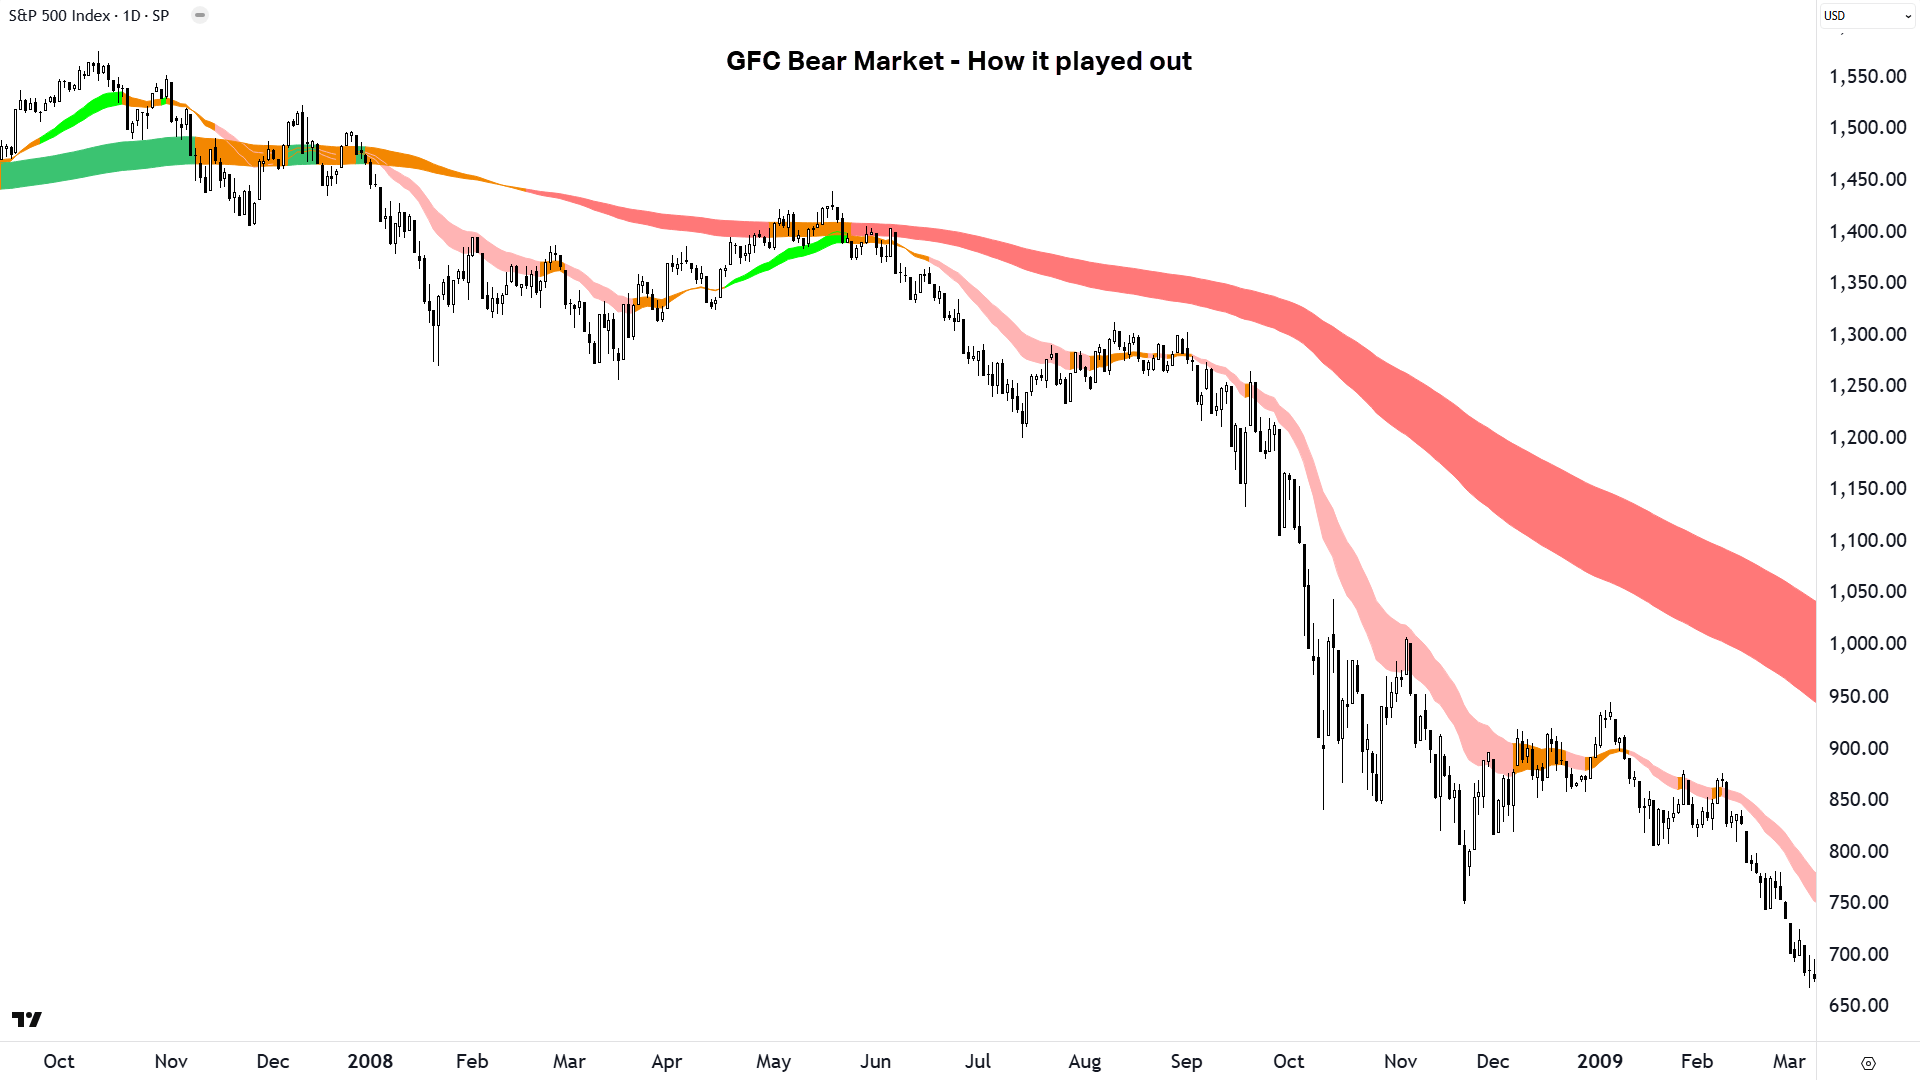
The price action (falling peaks and falling troughs), the candles (growing predominantly supply-side in nature), and the long term trend ribbon (neutral) all flashed clear warning signals heading into the GFC Bear Market. As the long term trend ribbon grew increasingly strong in acting as a zone of dynamic supply – the rest was largely inevitable. A great market for shorts, though.

2018 Bear Market
I was tossing up whether to include this one, as you would hardly call it a major market calamity like each of the others featured – but I believe this downturn is important if only for the reasons why it occurred.
In late 2018 we had a sharp, brief bear market, with the ASX 200 and S&P 500 dipping over 20% from their highs. The trigger? President Trump’s escalating trade war with China during which he slapped tariffs on billions in goods (sound familiar?).
The uncertainty over the impact of the tariffs, and China’s response, spooked investors, while at the same time rising U.S. interest rates tightened financial conditions. This is often the case with respect to market calamities – a few unrelated events all of a sudden conspire to rattle investor confidence.

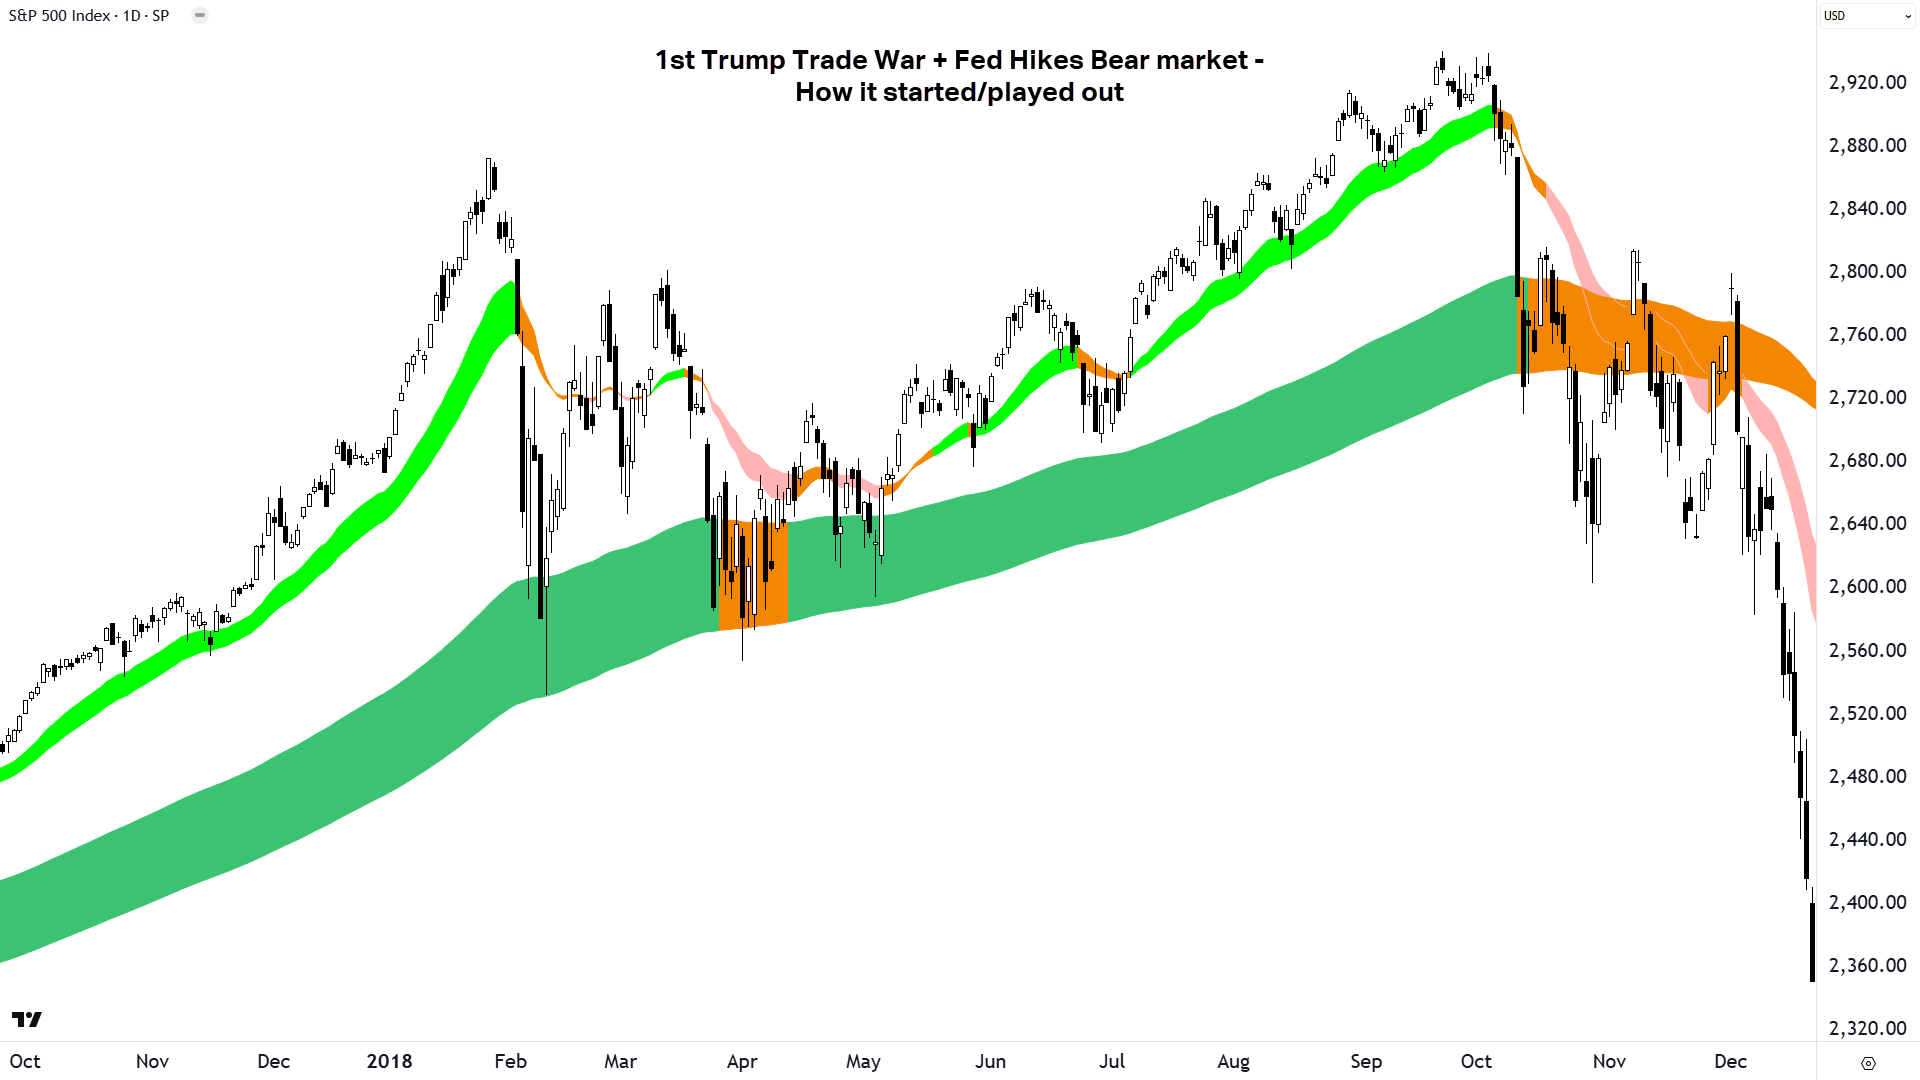
As quick as this bear market played out – it still demonstrated each of the key hallmarks of my transition to a bear market technical methodology.
You should be familiar with them by now, so I won’t repeat the obvious – but I must point out (ahem, boast) just how perfect my trend ribbons were at warning something wasn’t quite right with the market heading into this bear market.
2020 COVID-19 Pandemic Bear Market
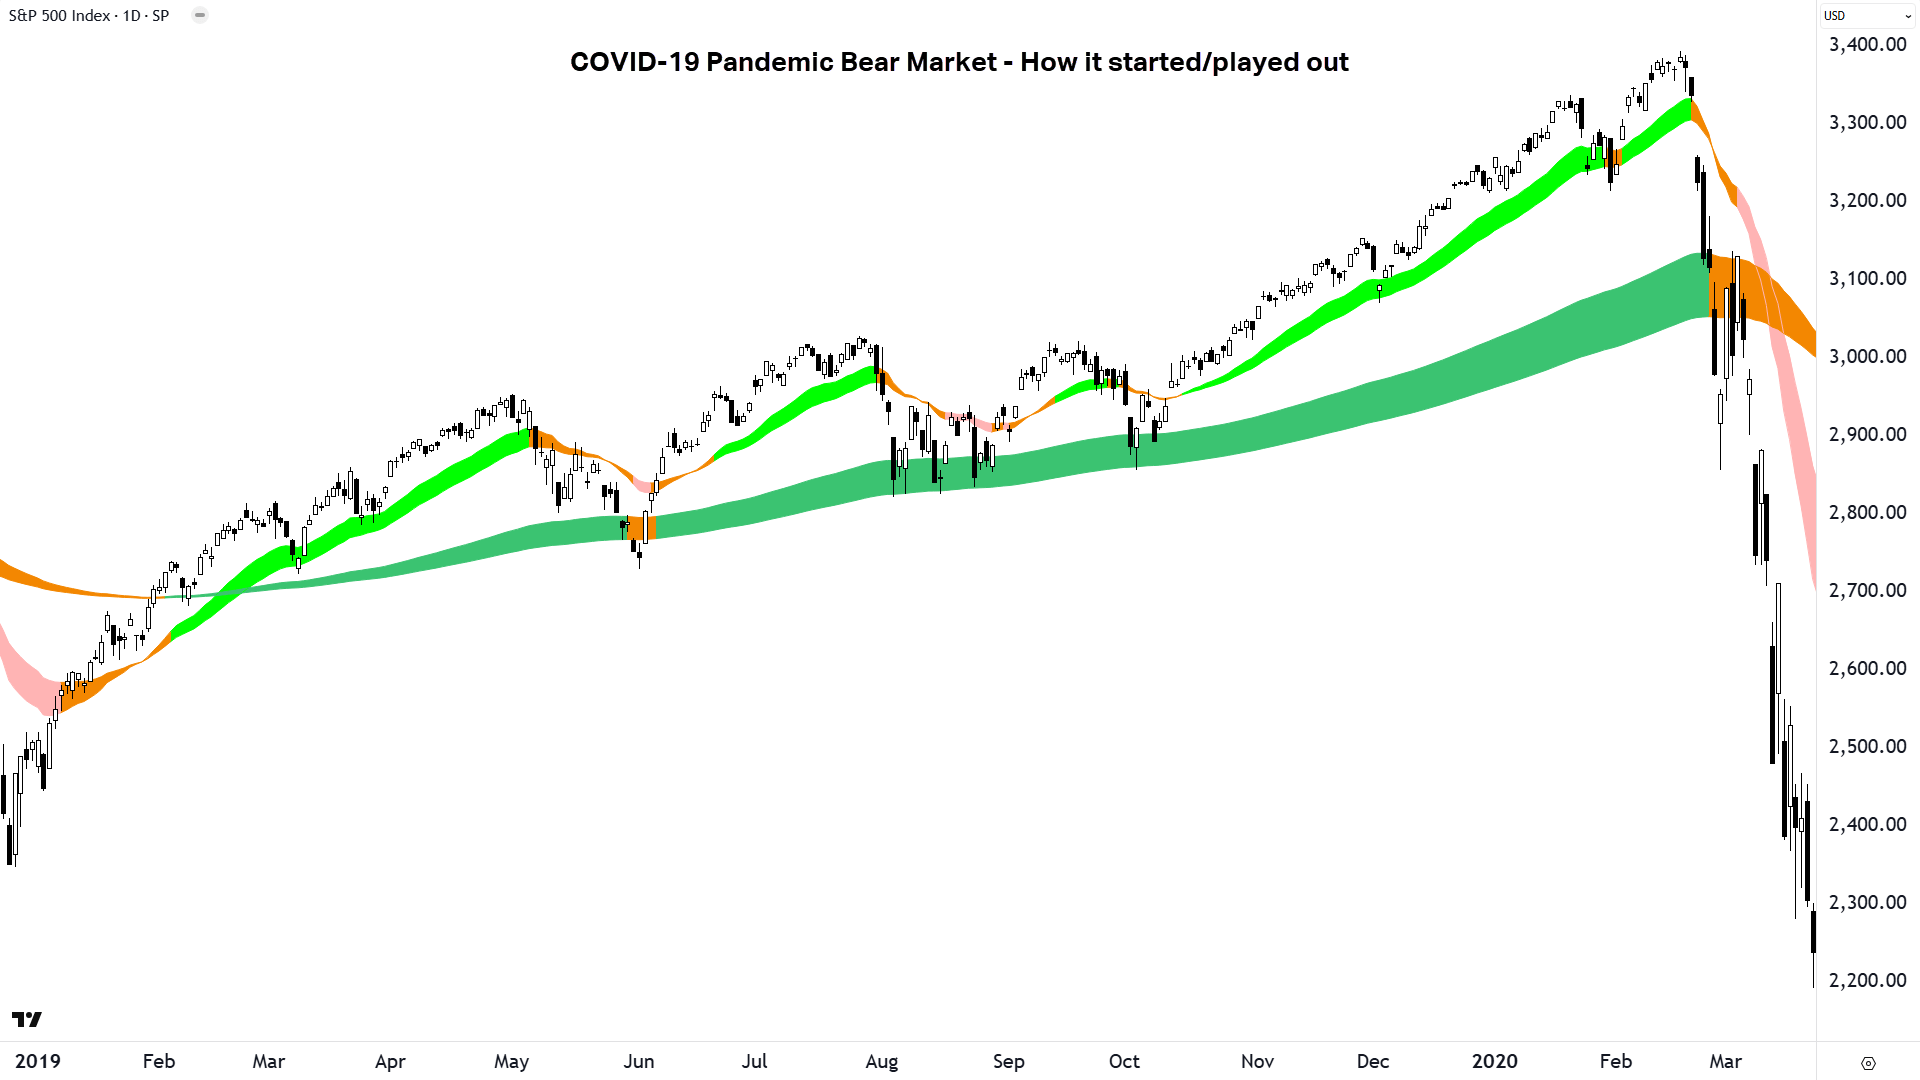
This might be the first taste of a bear market for many of you. March 2020 was chaos. As the COVID-19 virus spread, so too did uncertainty and panic over how it would impact the global economy. The ASX 200 and S&P 500 went into freefall – each plunging over 30% in weeks.
But, much as I had learned from my past mistakes – clearly by this stage so too had governments, central banks, and financial regulators. They unleashed unprecedented, coordinated stimulus, cushioning the blow of the pandemic and sparking a rapid rebound in economic growth and stock markets.
This is probably the worst kind of bear market to cut your teeth in because you’re far less likely to learn the critical lessons that can only come from many years of suffering! Still, the sheer speed of this crash/bear market showed how external shocks can overwhelm even robust markets, especially when fear outpaces fundamentals.

Too sudden, too left field. There’s not a great deal my transition to a bear market technical methodology could have done here. Certainly though, the gap-and-run black candles that started the downturn were a substantial shot across the bow of the prevailing bull market, and should have been enough to signal the need for at least a paring of risk.
I will claim a win on the proficiency of my long term trend ribbon to signal long term trend change, however, as it nailed the break-retest-and-fail move in March. Once that long term trend ribbon begins to act as a zone of dynamic supply – it’s rarely a good sign for the bulls.
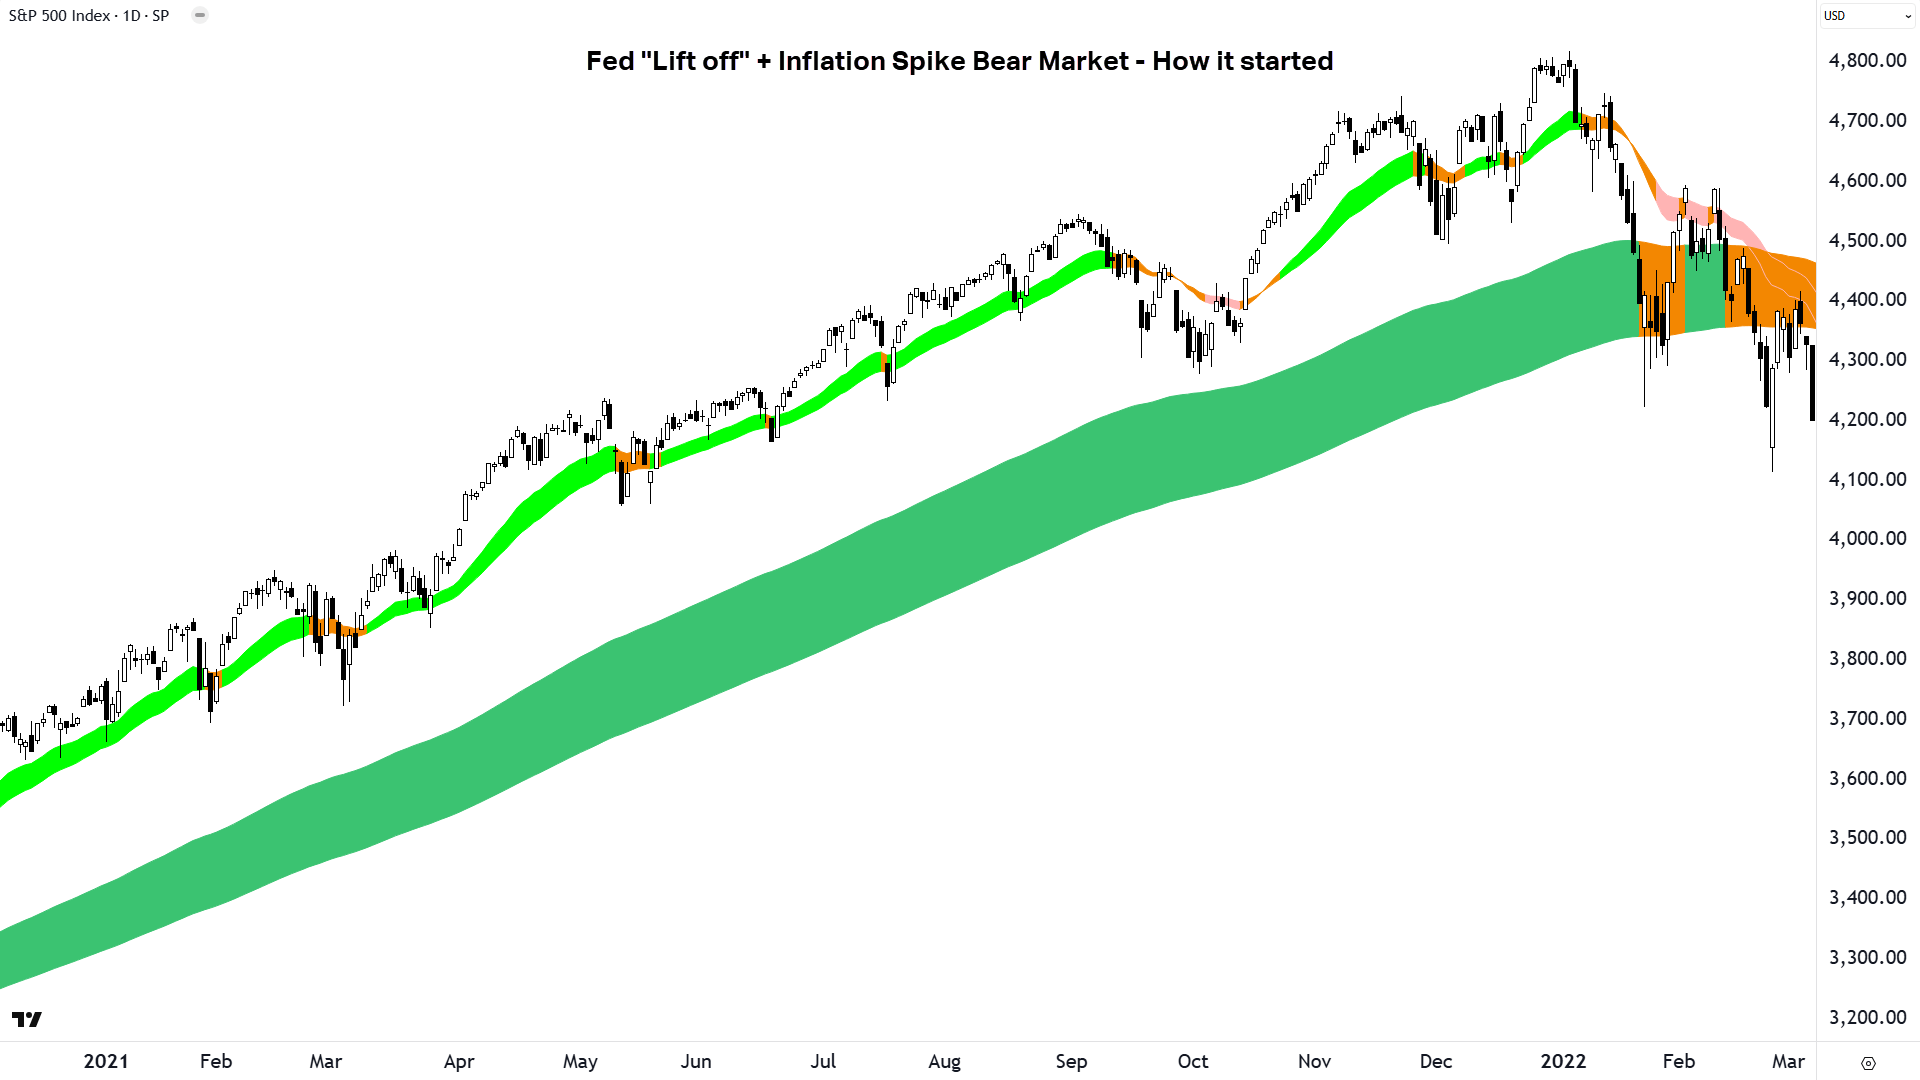
2022 Fed Lift-Off and Inflation Spike Bear Market
For every action there’s a reaction. It’s true in physics and it's true in economics. The response to the pandemic saved both households and markets, but it created an inflationary pulse not seen in two generations.
In 2022, markets buckled as the U.S. Federal Reserve hiked rates to combat soaring inflation, at least partly exacerbated by Russia’s invasion of Ukraine (remember how exogenous shocks can come together?). The ASX 200 and global indices shed over 20% as high-PE growth stocks, reliant on the cheap money that had flooded the system since the pandemic, cratered.

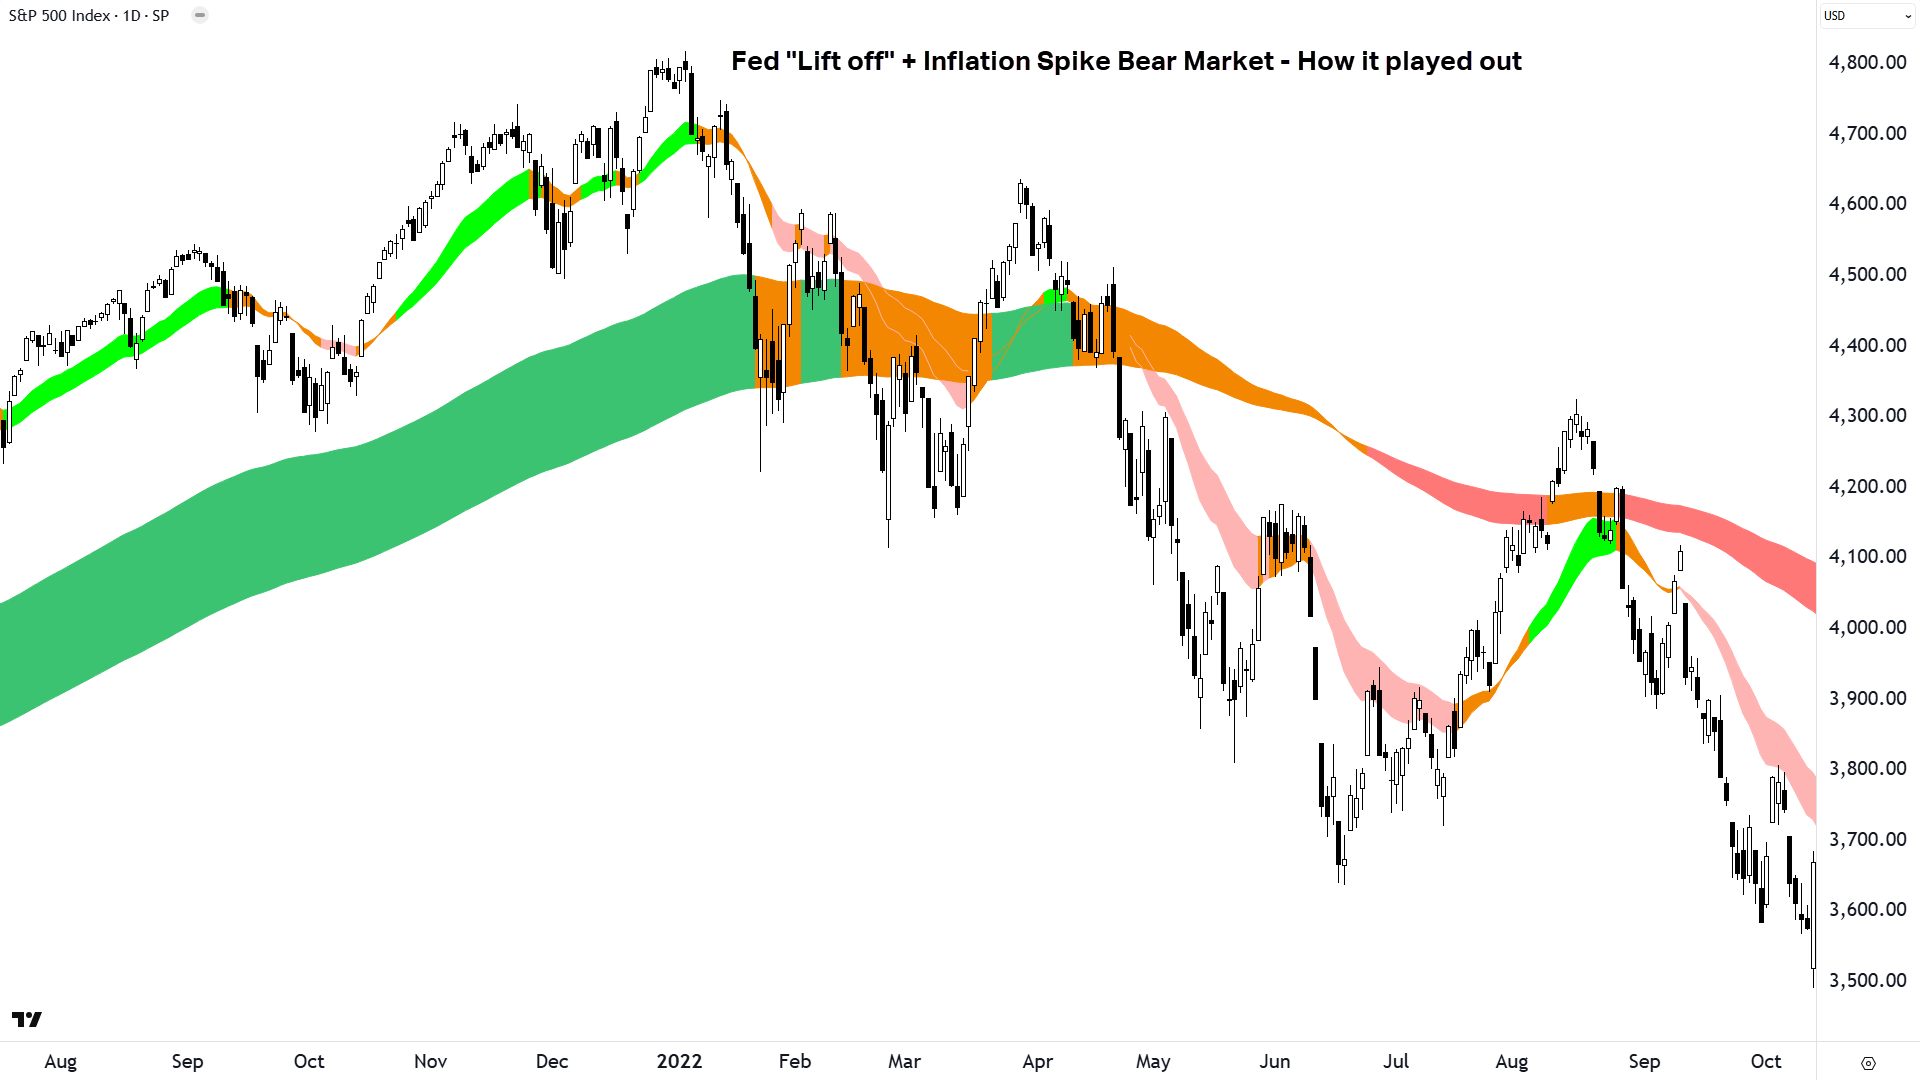
A textbook transition to a bear market – one couldn’t have asked for a more obvious set of technicals. I nailed this one, calling it very early, and maintaining a short-biased approach all the way down in the bear market that followed (there are plenty of videos and articles in the media where I warn investors about the transition).
Yes, I knew about the fundamentals, it is my business to do so – but I never let my opinions on the fundamentals override my technical methodology.

The present environment
Here we are! Global uncertainty brought about by President Trump’s latest trade war, lingering inflation concerns, geopolitical tensions, slowing global growth. Many of the usual suspects! Need I say more? It’s different, but let’s face it – the same.

OK, a little presumptuous/cheeky me calling this “Bear Market - How it started”. I am not a prognosticator; I am a trend follower. I do not know what is going to happen next in markets.
All I do is read how the demand-supply environment responds to stimuli – bullish or bearish. The good news is, it’s pretty much responded in the same way since a single tulip bulb could have bought you a nice house in Amsterdam.
In times of uncertainty, supply of stocks increases and demand for stocks decreases. You could describe this another way: Supply of risk increases and demand for cash (certainty) increases.
This is borne out in the technicals by an increasing predominance of black-bodied candles (and or those with upward pointing shadows), supply-side price action (falling peaks and falling troughs), and these trigger the transition of my short and long term trend ribbons from double-green to double-pink via an amber phase.
Importantly, the long term trend ribbon – which for so long has generally acted as a cradle for the price in question – begins to inhibit its upside potential. Then the transition is complete.
Looking up, we’re not even close to this yet – but there are substantial warning signs. Candles, price action, and the short term trend are consistent with supply-side control of the S&P 500’s price. The long term uptrend ribbon has been breached and it has transitioned to neutral.
We are in the early stages of a potential transition into a bear market. It is clear. Just as clear, though, is the requirement to remain vigilant in our analysis, and therefore to confirm the final, critical pieces of the trend change puzzle.
Conclusion
There’s an old saying: History doesn’t repeat, but it sure does rhyme. From oil shocks to tech-bubbles, trade wars to pandemics, the past 50 years reveal an undeniable truth: Those who ignore past mistakes risk reliving them.
I hope that the work I have done over three decades in determining the hallmarks of transitions between bull and bear markets will save you much of the pain I endured to discover them.
Carl's ChartWatch Series - Learn more about technical analysis
For a detailed explanation of Carl's technical analysis methodology, be sure to check out this ChartWatch Primer. You might also want to keep up with his regular technical analysis reports on major market indices, commodities, bonds, and crypo, in the ChartWatch section of our Evening Wrap, or daily for ASX stocks in ChartWatch ASX Scans.
This article first appeared on Market Index on Wednesday 12 March 2025.
Never miss an update
Enjoy this wire? Hit the ‘like’ button to let us know.
Stay up to date with my current content by
following me below and you’ll be notified every time I post a wire
Carl has over 30-years investing experience and has helped investors navigate several bull and bear markets over this time. He is a well respected markets commentator who specialises in how the global macro impacts Australian and US equities. Carl has a passion for technical analysis and has taught his unique brand of price-action trend following to thousands of Aussie investors.
........
Investing is risky. Inevitably you will endure losses. If you can't cope with losing, don't invest.

5 topics
1 stock mentioned

Carl has over 30-years investing experience and has helped investors navigate several bull and bear markets over this time. He is a well respected markets commentator who specialises in how the global macro impacts Australian and US equities. Carl...
Carl has over 30-years investing experience and has helped investors navigate several bull and bear markets over this time. He is a well respected markets commentator who specialises in how the global macro impacts Australian and US equities. Carl...
Comments
Comments
Sign In or Join Free to comment