TOL - 28th Feb, 2025
Massive brokers vs ASX mining earnings review: BHP, RIO, FMG, MIN, PLS and more
As February earnings season enters its final weeks, we have the latest broker responses to results from the major ASX mining companies.
It only happens twice a year, February and August – ASX earnings season can make or break a company’s next six months' price performance. To help you make sense of the current December half / FY December results from the ASX’s biggest mining companies, we have compiled the latest results summaries, recent price trends, and broker ratings and target price changes.
The companies covered in today’s ASX mining sector earnings deep dive include (alphabetical order, latest Broker Consensus Rating and distance to Broker Consensus Target also shown):
- BHP Group (BHP) – BUY | 11.2% UNDERVALUED
- Deterra Royalties (DRR) – BUY | 17.7% UNDERVALUED
- Fortescue (FMG) – HOLD | 1.5% OVERVALUED
- IGO (IGO) – HOLD | 23.8% UNDERVALUED
- Iluka Resources (ILU) – HOLD | 28.8% UNDERVALUED
- Mineral Resources (MIN) – HOLD | 31.9% UNDERVALUED
- Nickel Industries (NIC) – BUY | 40.6% UNDERVALUED
- Pilbara Minerals (PLS) – BUY | 36.7% UNDERVALUED
- Rio Tinto (RIO) – BUY | 6.7% UNDERVALUED
- Sandfire Resources (SFR) – HOLD | 0.5% OVERVALUED
- South32 (S32) – BUY | 6.7% UNDERVALUED
BHP Group (ASX: BHP)
BHP company description
BHP is a major global mining conglomerate focussed on the exploration, development, and production of essential commodities, including iron ore, copper, nickel, uranium, and metallurgical coal. The company operates extensive mining assets across Australia, the Americas, and other regions, with significant operations in Western Australia, Queensland, Chile, and Canada. Notably, BHP is advancing the Jansen Potash Project in Saskatchewan, Canada, aiming to become a key supplier of potash to support sustainable agriculture.
BHP 5-year chart history
BHP is trading near the low of its 2-year trading range, and is trying to once again bounce from the psychological and technical $40 support level. It has managed to do so several times over the last 5-years – only to eventually be repelled by the major $50 psychological and technical resistance level.
A close below the September 2024 low of $38.28 may continue 2024’s downtrend, whilst alternatively, a close above the December 2024 high of $42.27 may confirm a new uptrend.

BHP 5-year chart history
BHP key earnings numbers
- Revenue: US$25.2 billion vs FactSet consensus US$25.01 billion
- Free cash flow: US$2.6 billion vs FactSet consensus US$3.96 billion
- Net operating cash flow US$8.3 billion vs previous corresponding period US$8.9 billion
- Dividend: US$0.50 fully franked, ex-dividend* 6 March (grossed up trailing 12-month dividend yield^ is 6.6%)
- Guidance: production and costs unchanged; Capital expenditures (“CAPEX”) US$10 billion vs FactSet consensus US$10.02 billion
BHP broker consensus changes
To obtain a stock’s Broker Consensus Rating, we assign a value of +1 to any rating better than HOLD/NEUTRAL/MARKETWEIGHT, a value of 0 for any rating equivalent to HOLD/NEUTRAL/MARKETWEIGHT, and a value of -1 to any rating worse than HOLD/NEUTRAL/MARKETWEIGHT.
We then take the average of all assigned rating values and assign a Broker Consensus Rating of BUY to values greater than +0.5, a rating of HOLD for values between -0.5 and +0.5, and a rating of SELL for values less than -0.5.
The Broker Consensus Target is simply the average of the target prices we have on file for each broker. Typically, brokers define their target prices as a 12-month forecast. Each target price is based on fundamental valuation assumptions.
Only broker data we have on file from within the last 3-months has been used to keep the Consensus data current.

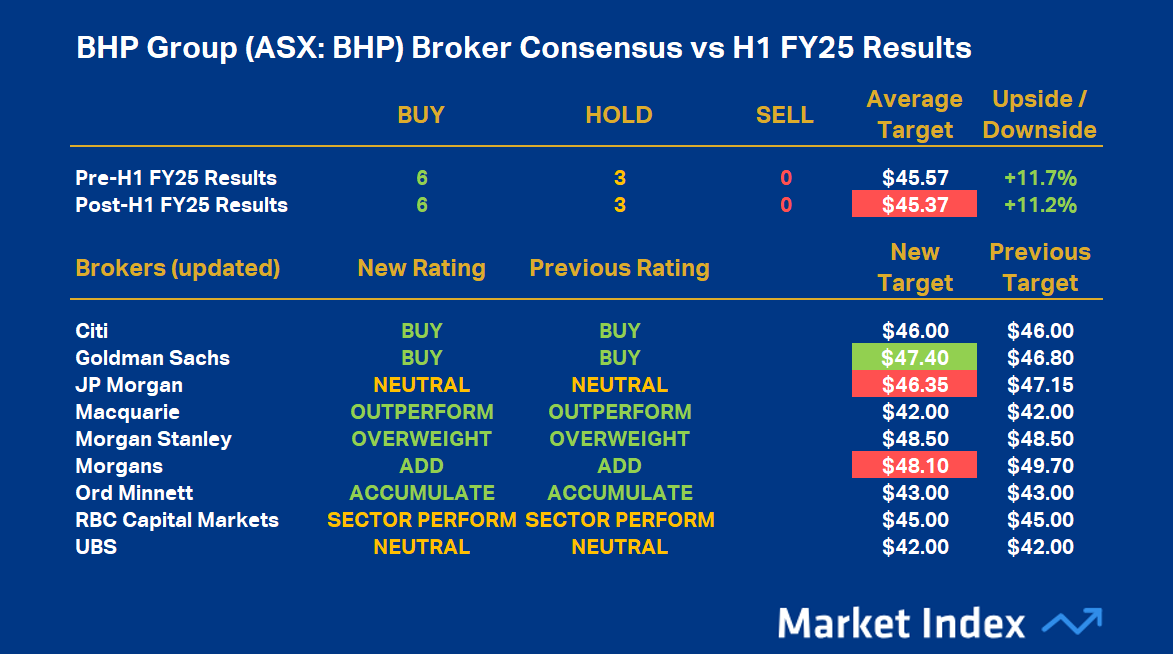
BHP broker consensus table (click here for full-size image)
BHP’s broker consensus rating is +0.67, unchanged after its results, leaving it with a Broker Consensus Rating of BUY. Its Broker Consensus Target is $45.37 (down 0.5% from $45.57 prior to results). This suggests brokers collectively believe the stock is around 11.2% undervalued based upon the closing price on Monday, 24 February of $40.80.
Deterra Royalties (ASX: DRR)
DRR company description
Deterra Royalties is a royalty investment company focussed on the management and growth of a diversified portfolio of royalty assets across bulk commodities, base, and battery metals. Established as an independent entity in 2020, Deterra's cornerstone asset is a royalty over BHP's Mining Area C (MAC) in Western Australia's Pilbara region, one of the world's largest iron ore operations.
The company's portfolio has expanded to include 28 royalties across 11 countries and six commodities, following the acquisition of Trident Royalties Plc in 2024. Deterra's business model focuses on high-margin, dividend-generating investments, with a disciplined approach to growth through the acquisition of royalties and providing financing to resource companies in exchange for royalty interests.
DRR 5-year chart history
DRR is trading near the low of its 5-year trading range, having suffered a sharp decline from the 2024 high near $5.50. It has, however, recovered modestly from recent lows below $3.50 on the back of a corresponding improvement in the iron ore price.
A close below the September 2024 low of $3.32 may continue 2024’s downtrend, whilst alternatively, a close above the 17 February high of $4.25 may confirm a new uptrend.

DRR 5-year chart history
DRR key earnings numbers
- Revenue: $112.3 million vs FactSet consensus $108.0 million
- Adjusted EBITDA: $105.9 million vs FactSet consensus $105.0 million
- Dividend: $0.09 fully franked, ex-dividend 25 February (grossed up trailing 12-month dividend yield is 8.6%)
DRR broker consensus changes
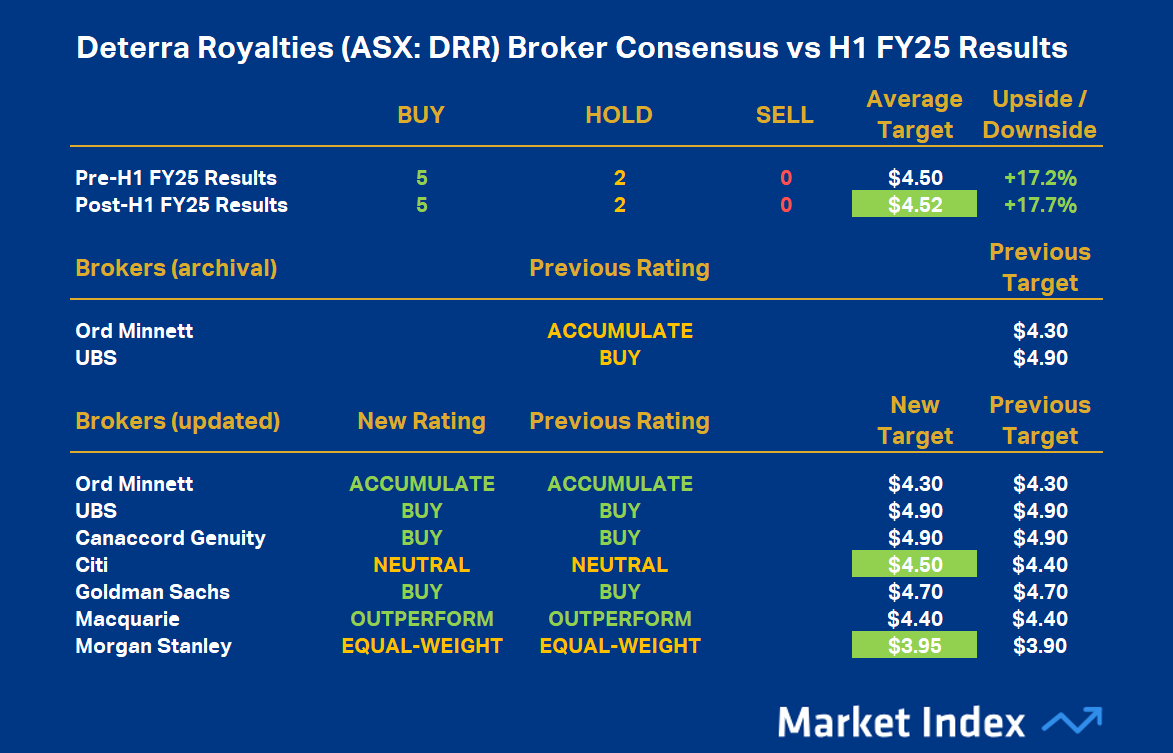
DRR broker consensus table (click here for full-size image)
DRR’s broker consensus rating is +0.71, unchanged after its results, leaving it with a Broker Consensus Rating of BUY. Its Broker Consensus Target is $4.52 (up 0.5% from $4.50 prior to results). This suggests brokers collectively believe the stock is around 17.7% undervalued based upon the closing price on Monday, 24 February of $3.84.
Fortescue (ASX: FMG)
FMG company description
Fortescue is focussed on iron ore production as well several development projects aimed at green energy initiatives. The company operates multiple mining hubs in the Pilbara region, including the Chichester and Solomon hubs, and has developed significant infrastructure such as a 260-kilometre private railway and the Herb Elliott Port in Port Hedland. In recent years, the company has expanded into green energy through its Fortescue Energy division, aiming to accelerate industrial decarbonisation by developing green hydrogen, ammonia, and renewable energy projects worldwide.
FMG 5-year chart history
FMG is trading near the lows of its 3-year trading range which sits at approximately $15. Since late-2021, dips to around $15 were generally bought into by market participants, with subsequent rallies to the $20-$25 range commonplace.
A close below the September 2024 low of $15.88 may continue 2024’s downtrend, whilst alternatively, a close above the December 2024 high of $20.75 may confirm a new uptrend.

FMG 5-year chart history
FMG key earnings numbers
- Revenue: US$7.64 billion vs FactSet consensus US$7.51 billion
- Underlying EBITDA: US$3.64 billion vs FactSet consensus US$3.63 billion
- Dividend: $0.50 fully franked, ex-dividend 26 February (grossed up trailing 12-month dividend yield is 10.6%)
- Guidance: iron ore shipments unchanged; C1 costs unchanged; CAPEX US$3.5 - $3.8 billion vs prior US$3.2-3.8 billion
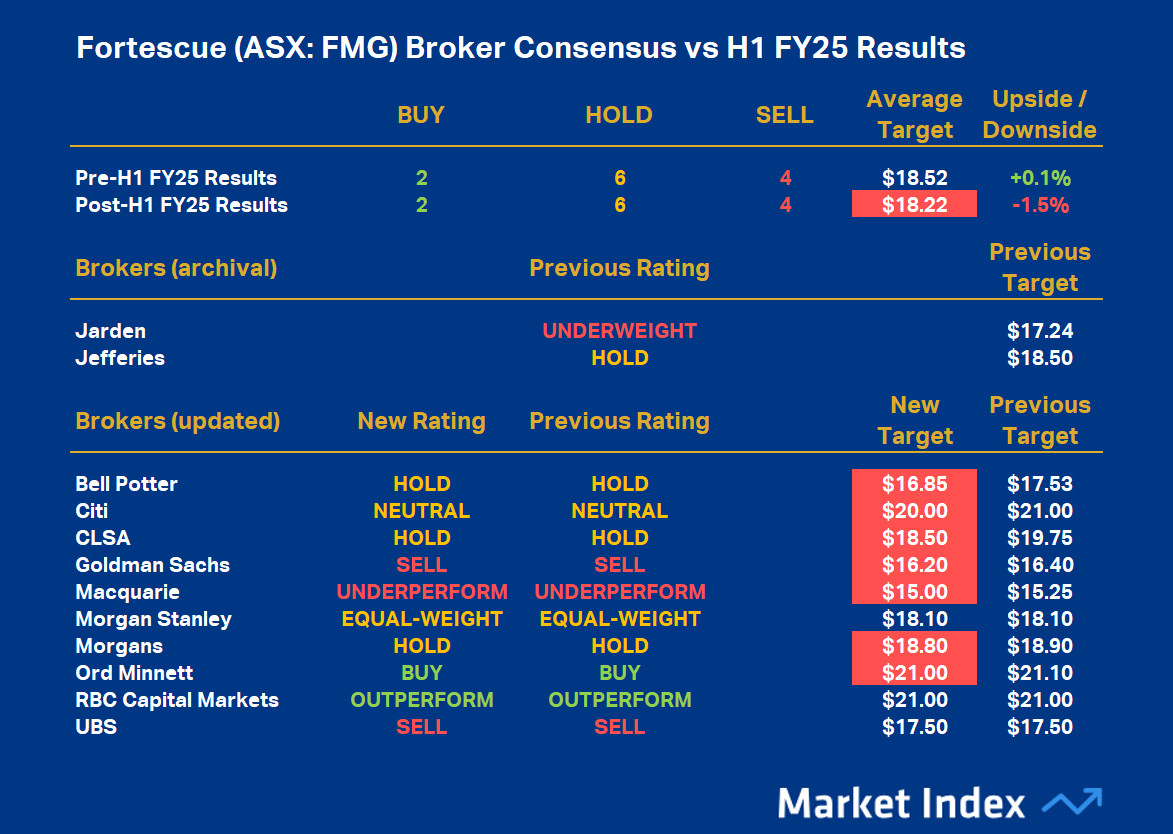
FMG broker consensus changes

FMG’s broker consensus rating is -0.17, unchanged after its results, leaving it with a Broker Consensus Rating of HOLD. Its Broker Consensus Target is $18.22 (down 1.6% from $18.52 prior to results). This suggests brokers collectively believe the stock is around 1.5% overvalued based upon the closing price on Monday, 24 February of $18.50.
IGO (ASX: IGO)
IGO company description
IGO is a mining and exploration focussed on exploration, development, and production of minerals critical to clean energy, including nickel, copper, cobalt, and lithium. IGO's key operations include the Nova Operation, an underground mine in the Fraser Range producing nickel, copper, and cobalt concentrates; the Forrestania Operation, comprising the Flying Fox and Spotted Quoll underground mines; and a 25% interest in the Greenbushes Lithium Mine, one of the world's largest lithium producers. Additionally, IGO holds a 49% interest in the Kwinana Lithium Hydroxide Refinery, enhancing its position in the battery materials supply chain.
IGO 5-year chart history
IGO is trending towards the bottom of its 5-year historical price range. If one zooms out beyond the 5-year history, there is a potential long term support level at the January 2016 low around $2.

IGO 5-year chart history
IGO key earnings numbers
- Revenue: $284 million vs FactSet consensus $275 million
- Adjusted EBITDA: -$82 million (i.e., a loss) vs FactSet consensus -$81.7 million
- Dividend: Nil
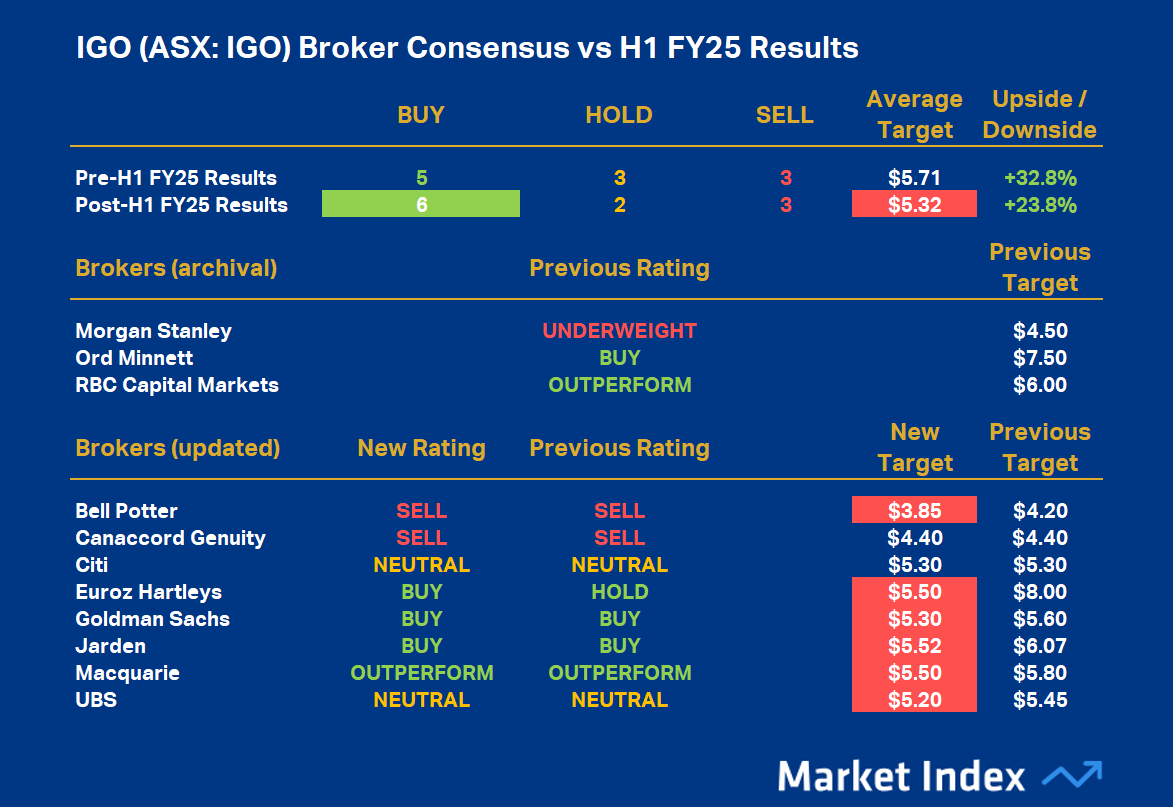
IGO broker consensus changes

IGO broker consensus table (click here for full-size image)
IGO’s broker consensus rating is +0.27, up from +0.18 prior to its results, leaving it with a Broker Consensus Rating of HOLD. Its Broker Consensus Target is $5.32 (down 1.0% from $5.71 prior to results). This suggests brokers collectively believe the stock is around 23.8% undervalued based upon the closing price on Monday, 24 February of $4.30.
Iluka Resources (ASX: ILU)
ILU company description
Iluka Resources is a critical minerals company focussed on the exploration, development, mining, processing, and marketing of mineral sands. The company is the world's largest producer of zircon and a significant producer of high-grade titanium dioxide products, including rutile and synthetic rutile. Iluka's operations are primarily located in Australia, with key sites such as the Jacinth-Ambrosia mine in South Australia and the Cataby mine in Western Australia. The company is also developing a fully integrated rare earths refinery at Eneabba in Western Australia, aiming to become a globally significant producer of both light and heavy rare earths, essential for an electrified, lower-carbon economy.
ILU 5-year chart history
ILU is trending towards the bottom of its 5-year historical price range. If one zooms out beyond the 5-year history, there is a potential long term support level at the December 2015 low around $2.42.

ILU 5-year chart history
ILU key earnings numbers
- Mineral sands revenue: $1.13 billion vs FactSet consensus $1.14 billion
- Underlying EBITDA: $498.8 million vs FactSet consensus $485.8 million
- Dividend: $0.04 fully franked, ex-dividend 4 March (grossed up trailing 12-month dividend yield is 2.6%)
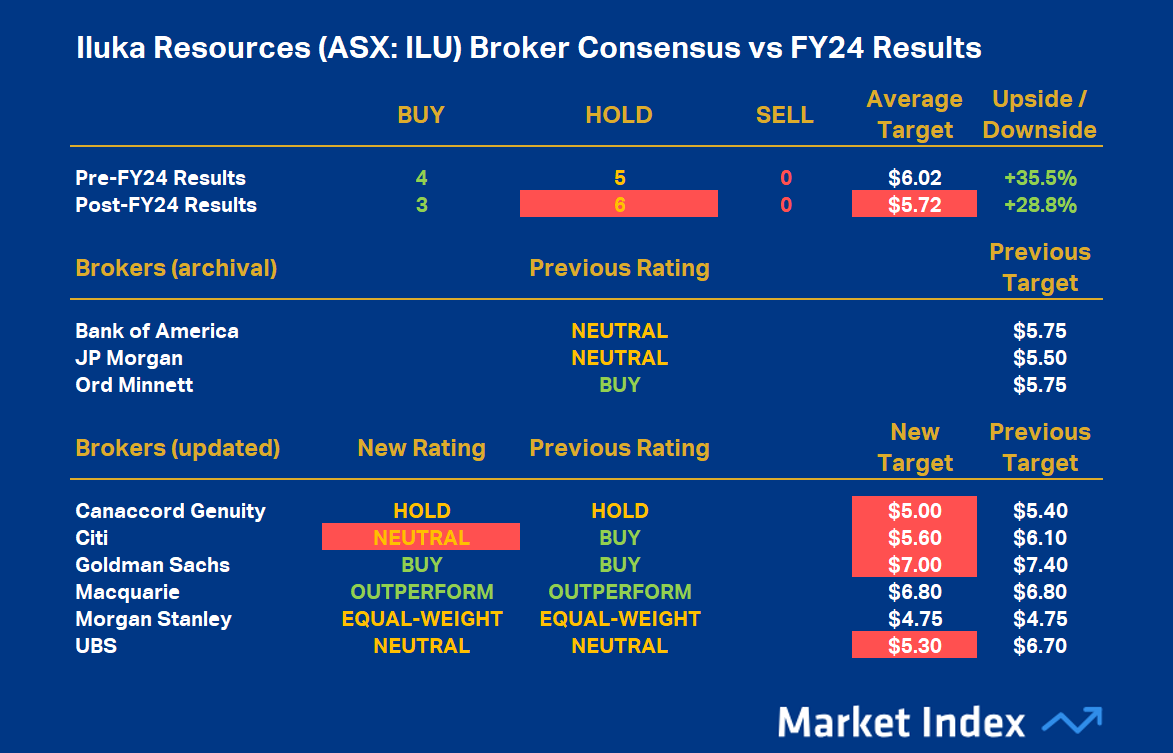
ILU broker consensus changes

ILU broker consensus table (click here for full-size image)
ILU’s broker consensus rating is +0.33, down from +0.44 prior to its results, leaving it with a Broker Consensus Rating of HOLD. Its Broker Consensus Target is $5.72 (down 6.7% from $6.02 prior to results). This suggests brokers collectively believe the stock is around 28.8% undervalued based upon the closing price on Monday, 24 February of $4.44.
Mineral Resources (ASX: MIN)
MIN company description
More commonly known as “MinRes”, it is a diversified resources company that operates extensively across Western Australia. MinRes is focussed on the mining of iron ore and lithium, as well as providing comprehensive mining services. Its wholly-owned subsidiary, CSI Mining Services, offers pit-to-port solutions, including mining, processing, transport, and logistics. The company is also involved in energy through natural gas exploration and production. MinRes is currently developing the Onslow Iron project in the Pilbara region, aiming to enhance its existing iron ore production capabilities.
MIN 5-year chart history
MIN has broken through the bottom of a historical price range that saw several bounces from $40 and then $60. It is now trending towards the bottom of its 5-year historical price range. The low during the COVID-19 bear market of 2020 was $12.11, but there is a potential historical support point from the January 2018 peak of $22.14 that could come into play prior.

MIN 5-year chart history
MIN key earnings numbers
- Revenue: $2.29 billion vs FactSet consensus $2.015 billion
- Underlying EBITDA: $302 million vs FactSet consensus $212 million
- NPAT: -$807 million (includes $352 million post-tax impairment charges primarily related to Bald Hill, $232 million post-tax translation impact on foreign currency denominated balances) vs FactSet consensus -$279 million
- Dividend: Nil
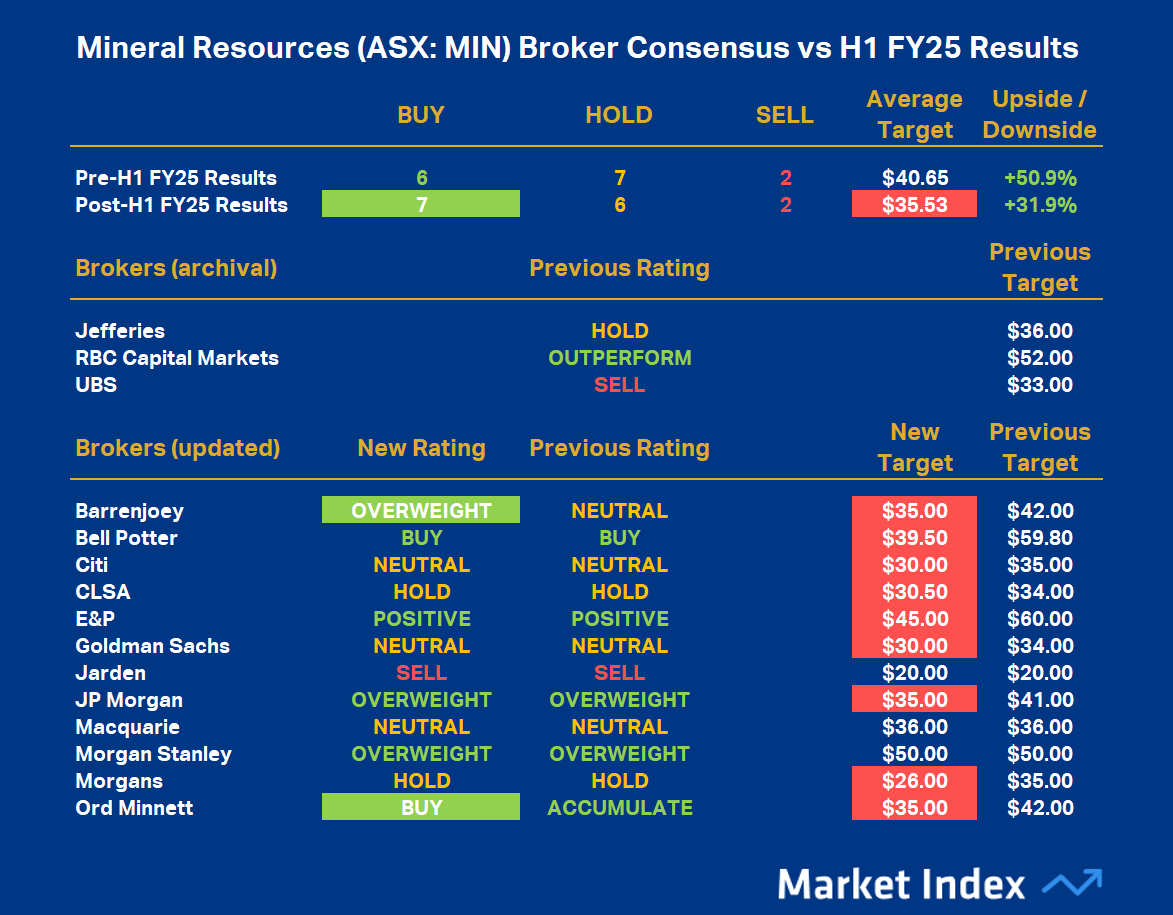
MIN broker consensus changes

MIN broker consensus table (click here for full-size image)
MIN’s broker consensus rating is +0.33, up from +0.27 prior to its results, leaving it with a Broker Consensus Rating of HOLD. Its Broker Consensus Target is $35.53 (down 19% from $40.65 prior to results). This suggests brokers collectively believe the stock is around 31.9% undervalued based upon the closing price on Monday, 24 February of $26.94.
Nickel Industries (ASX: NIC)
NIC company description
Nickel Industries is focussed on nickel mining and processing, with main operations in Indonesia. The company owns a portfolio of mining and low-cost downstream nickel processing assets, producing nickel for the stainless-steel industry and the electric vehicle (“EV”) supply chain. Key assets include the Hengjaya Mine, a high-grade nickel laterite deposit, and several Rotary Kiln Electric Furnace (RKEF) projects within the Indonesia Morowali Industrial Park and the Indonesia Weda Bay Industrial Park.
Nickel Industries is transitioning its production to focus on the EV battery supply chain, including converting some of its existing production from nickel pig iron to nickel matte and acquiring a 10% interest in the Huayue Nickel Cobalt High-Pressure Acid Leach (HPAL) project, adding mixed hydroxide precipitate to its product portfolio.
NIC 5-year chart history
NIC is trading just off the bottom of its 5-year historical price range. The January 2024 low of $0.54 is the most logical long term historical support point. A close below this point would likely continue the longer term downtrend, whilst alternatively, a close above the October 2024 high of $0.995 would likely start a new uptrend.

NIC 5-year chart history
NIC key earnings numbers
- Revenue: US$1.74 billion vs FactSet consensus US$1.69 billion
- Adjusted EBITDA: US$296.8 million vs FactSet consensus US$296.0 million
- Dividend: $0.019 unfranked, ex-dividend 21 February (grossed up trailing 12-month dividend yield is 8.2%)
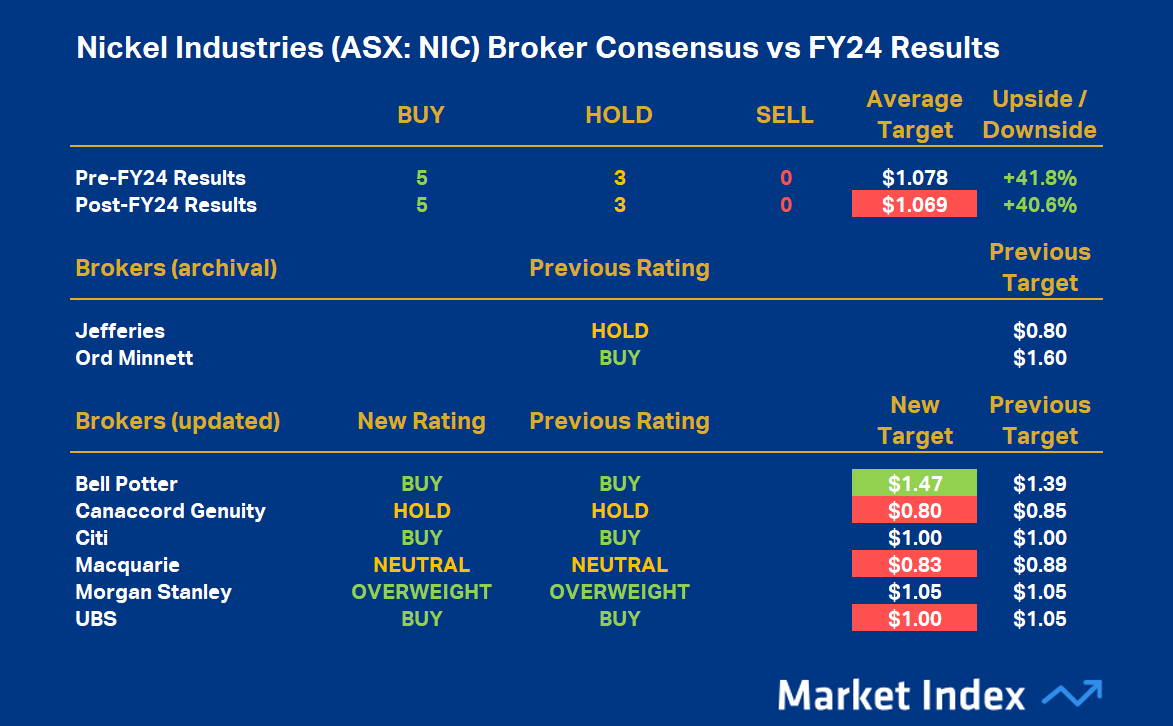
NIC broker consensus changes

NIC’s broker consensus rating is +0.63, unchanged after its results, leaving it with a Broker Consensus Rating of BUY. Its Broker Consensus Target is $1.069 (down 0.8% from $1.078 prior to results). This suggests brokers collectively believe the stock is around 40.6% undervalued based upon the closing price on Monday, 24 February of $0.76.
Pilbara Minerals (ASX: PLS)
PLS company description
Pilbara Minerals is a hard rock lithium producer via its 100% owned Pilgangoora Operation, located approximately 140 kms from Port Hedland in the Pilbara region. This operation is recognised as one of the world's largest independent hard-rock lithium mines, producing spodumene and tantalite concentrates. Pilbara Minerals has established strategic partnerships, including a joint venture with POSCO in South Korea, which manufactures battery-grade lithium hydroxide. The company is also expanding its global footprint with the acquisition of the Colina Project in Brazil.
PLS 5-year chart history
PLS has been trending lower since late-2022, and is now threatening to break below the $2 point of historical support. Below $2, there is a consolidation zone from 2021 that tops out around $1.47 that may offer potential technical support down the track.

PLS 5-year chart history
PLS key earnings numbers
- Revenue: $426 million vs FactSet consensus $428.9 million
- Underlying EBITDA: $74 million vs guidance $71-75 million
- Dividend: Nil
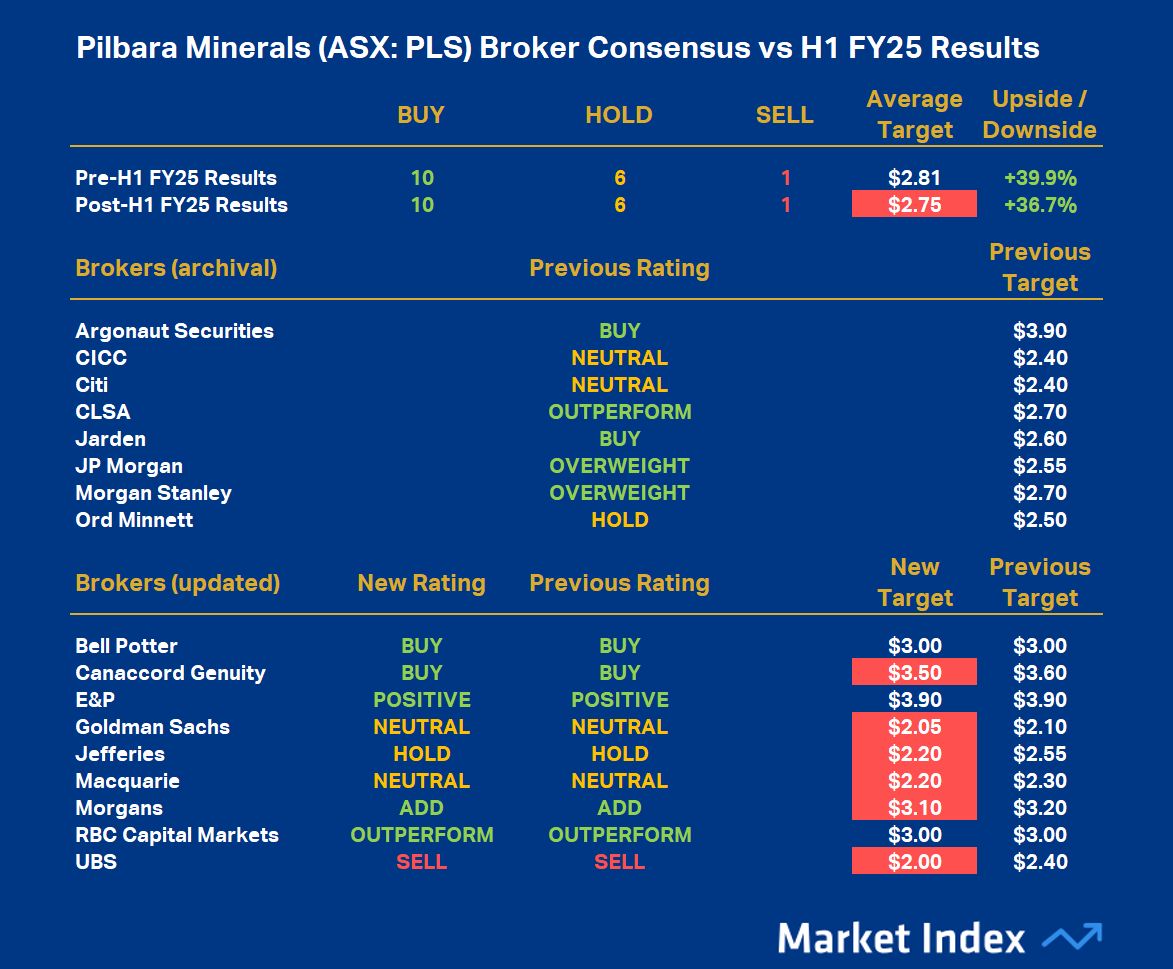
PLS broker consensus changes

PLS’s broker consensus rating is +0.53, unchanged after its results, leaving it with a Broker Consensus Rating of BUY. Its Broker Consensus Target is $2.75 (down 3.2% from $2.81 prior to results). This suggests brokers collectively believe the stock is around 36.7% undervalued based upon the closing price on Monday, 24 February of $2.01.
Rio Tinto (ASX: RIO)
RIO Company description
Rio Tinto Group is a leading global mining and metals company with dual headquarters in the UK and Australia. The company operates in 35 countries, producing essential materials such as iron ore, aluminum, copper, and critical minerals vital for the global energy transition. In Western Australia's Pilbara region, Rio Tinto manages an integrated network of over 17 iron ore mines and four independent port terminals. The company is also expanding into lithium production, highlighted by its recent $6.7 billion acquisition of Arcadium Lithium, positioning Rio Tinto among the world's top lithium producers.
RIO 5-year chart history
RIO appears to have turned higher off a well defined 2-year trading range low around $105. It has typically in the past then found resistance above $130.
A close below the September 2024 low of $105.11 may continue 2024’s downtrend, whilst alternatively, a close above the December 2024 high of $126.04 may confirm the current fledgling uptrend is gaining momentum.

RIO 5-year chart history
RIO key earnings numbers
- Revenue: US$53.66 billion vs FactSet consensus US$53.49 billion
- Adjusted EBITDA: US$23.31 billion vs FactSet consensus US$23.03 billion
- Dividend: US$2.25 fully franked, ex-dividend 6 March (grossed up trailing 12-month dividend yield is 7.3%)
- Guidance: Prior FY25 production, costs, and CAPEX generally restated without changes
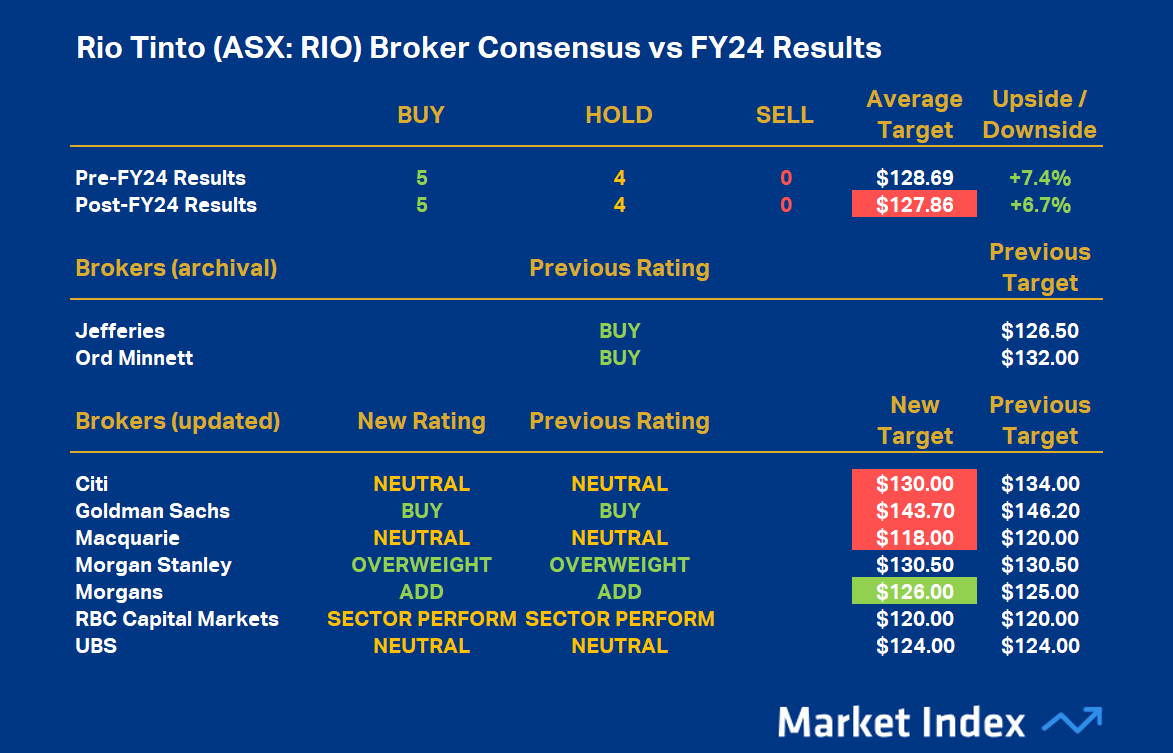
RIO broker consensus changes

RIO’s broker consensus rating is +0.56, unchanged after its results, leaving it with a Broker Consensus Rating of BUY. Its Broker Consensus Target is $127.86 (down 0.7% from $128.69 prior to results). This suggests brokers collectively believe the stock is around 6.7% undervalued based upon the closing price on Monday, 24 February of $119.80.
Sandfire Resources (ASX: SFR)
SFR company description
Sandfire Resources has evolved into a significant global copper producer with operations spanning Australia, Botswana, Spain, and the United States. Its flagship asset, the DeGrussa Copper-Gold Mine in Western Australia, provided the foundation for its growth. In 2022, Sandfire expanded its international presence by acquiring the MATSA mining complex in Spain, which comprises three underground mines and a 4.7 million tonnes per annum processing facility. The company is also developing the Motheo Copper Mine in Botswana's Kalahari Copper Belt, aiming to enhance its copper production capabilities. Committed to sustainable mining practices, Sandfire focuses on supplying copper, a metal essential for global electrification and decarbonisation efforts.
SFR 5-year chart history
SFR has been trading higher since the 2022 low. It is once again pushing towards the October 2024 peak at $11.33, which is likely to act as a potential near term major point of supply. If SFR can close above $11.33, it will be trading at record highs and therefore without any major historical points of resistance to impede its progress.

SFR 5-year chart history
SFR key earnings numbers
- Revenue: $572.3 million vs FactSet consensus $568.6 million
- Adjusted EBITDA: $255.2 million vs FactSet consensus $254.0 million
- Cash from operations: $262.4 million vs FactSet consensus $247 million
- Dividend: Nil
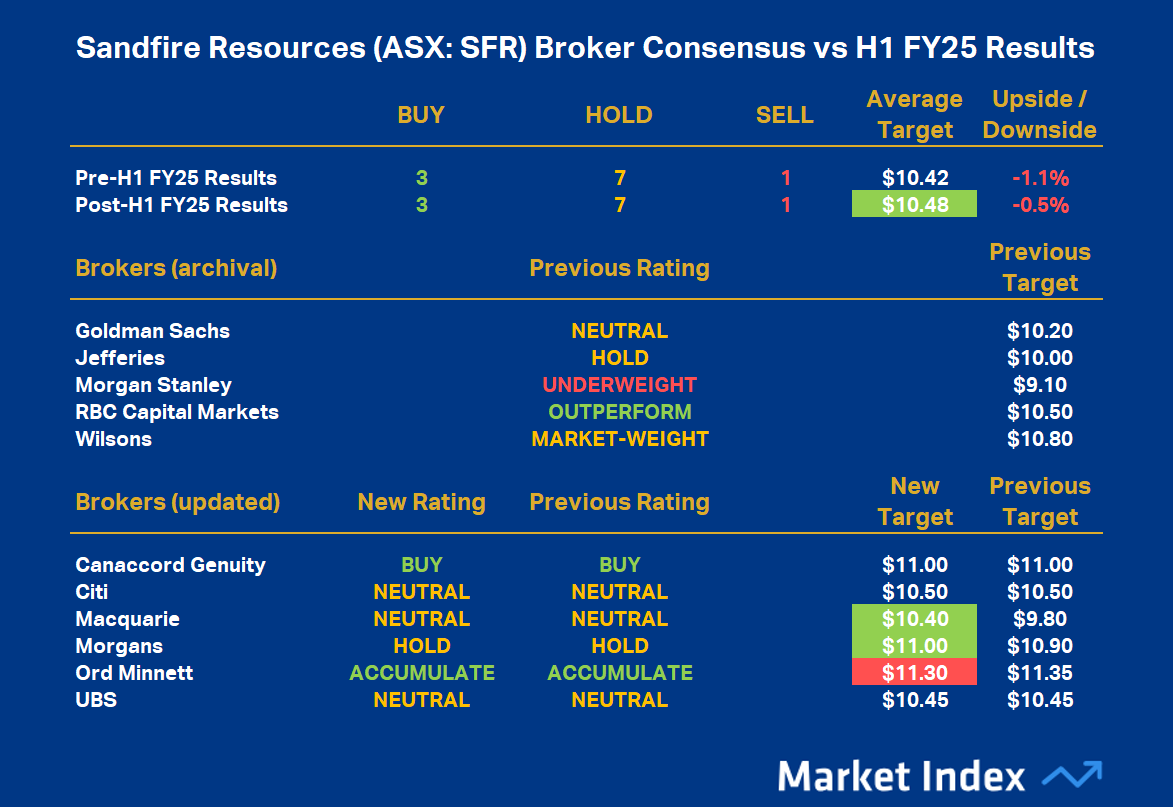
SFR broker consensus changes

SFR’s broker consensus rating is +0.18, unchanged after its results, leaving it with a Broker Consensus Rating of HOLD. Its Broker Consensus Target is $10.48 (up 0.6% from $10.42 prior to results). This suggests brokers collectively believe the stock is around 0.5% overvalued based upon the closing price on Monday, 24 February of $10.53.
South32 (ASX: S32)
S32 Company description
South32 is a globally diversified mining and metals company operating in Australia, Southern Africa, and South America. The company produces a broad range of globally critical commodities including alumina, aluminum, bauxite, copper, manganese, nickel, silver, lead, and zinc. Key operations encompass the Worsley Alumina refinery in Australia, the Cerro Matoso nickel mine in Colombia, and the Mozal Aluminium smelter in Mozambique.
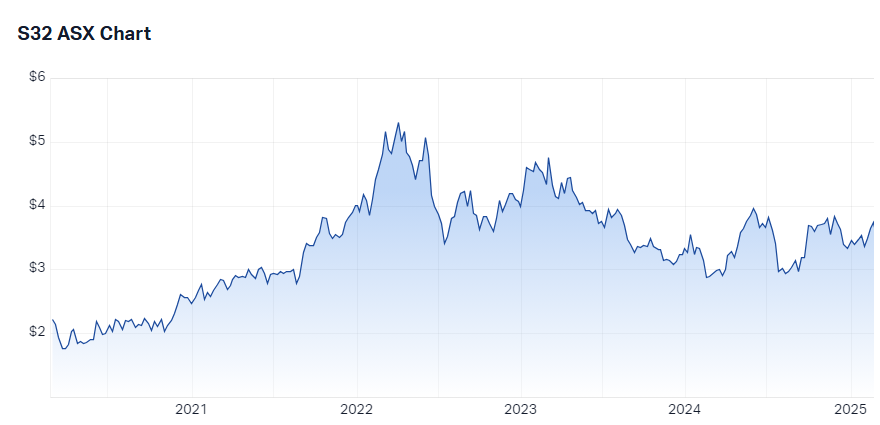
S32 5-year chart history
SFR appears to be turning higher off the bottom of its 3-year trading range after a long consolidation phase between $2.80-$4.00.
A close below the August 2024 low of $2.79 may continue 2023’s downtrend, whilst alternatively, a close above the November 2024 high of $3.95 may confirm the current fledgling uptrend is gaining momentum.
S32 5-year chart history
S32 key earnings numbers
- Underlying Revenue: US$3.85 billion vs FactSet consensus US$3.46 billion
- Underlying EBITDA: US$1.02 billion vs FactSet consensus US$911.9 million
- NPAT: US$359 million vs FactSet US$338.2 million
- Dividend US$0.034 full franked, ex-dividend 6 March (grossed up trailing 12-month dividend yield is 4.2%)
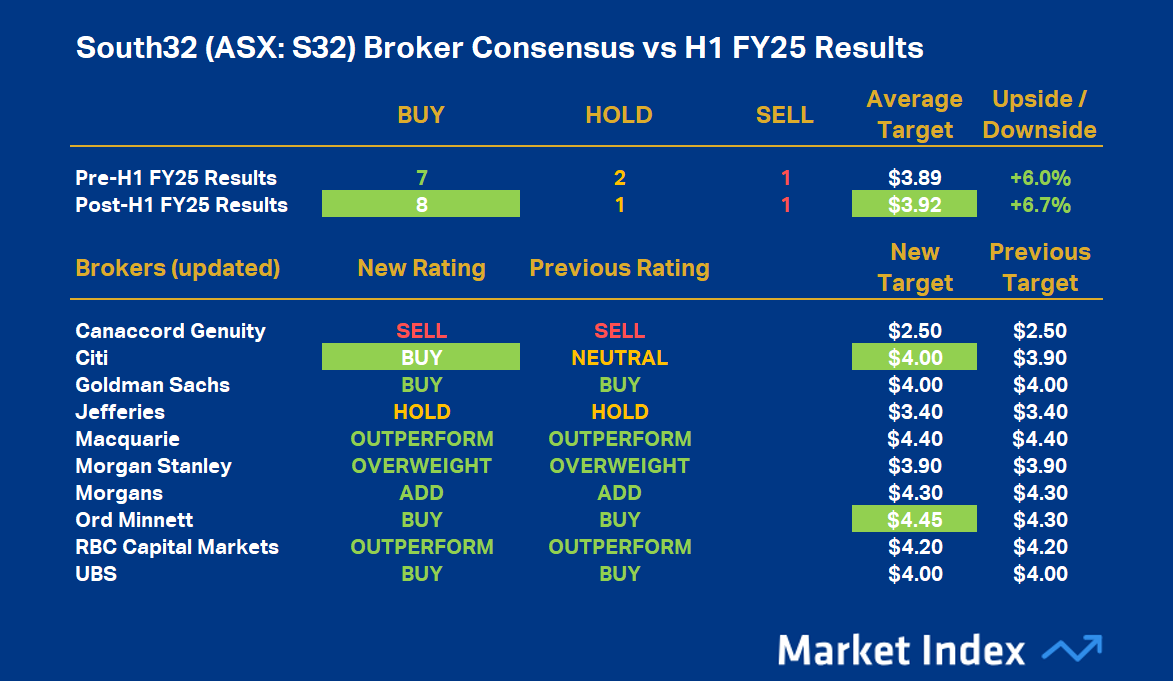
S32 broker consensus changes

S32’s broker consensus rating is +0.70, up from +0.60 prior to its results, leaving it with a Broker Consensus Rating of BUY. Its Broker Consensus Target is $3.92 (up 0.7% from $3.89 prior to results). This suggests brokers collectively believe the stock is around 6.7% undervalued based upon the closing price on Monday, 24 February of $3.67.
*You must be a shareholder prior to the ex-dividend date to be entitled to the dividend; ^Grossed up dividend yield takes into account any franking credits associated with a dividend and represents the potential after tax dividend to an Australian resident tax payer.
This article first appeared on Market Index on Tuesday 25 February 2025.
Never miss an update
Enjoy this wire? Hit the ‘like’ button to let us know.
Stay up to date with my current content by
following me below and you’ll be notified every time I post a wire
Carl has over 30-years investing experience and has helped investors navigate several bull and bear markets over this time. He is a well respected markets commentator who specialises in how the global macro impacts Australian and US equities. Carl has a passion for technical analysis and has taught his unique brand of price-action trend following to thousands of Aussie investors.
........
Investing is risky. Inevitably you will endure losses. If you can't cope with losing, don't invest.

5 topics
11 stocks mentioned

Carl has over 30-years investing experience and has helped investors navigate several bull and bear markets over this time. He is a well respected markets commentator who specialises in how the global macro impacts Australian and US equities. Carl...
Carl has over 30-years investing experience and has helped investors navigate several bull and bear markets over this time. He is a well respected markets commentator who specialises in how the global macro impacts Australian and US equities. Carl...
Comments
Comments
Sign In or Join Free to comment