A ticking time bomb in 7 charts

Chris Rands
Yarra Capital Management
In part one of this deep-dive, we analysed the economic impact a demographic headwind can have using Japan as a case in point. In part two, we looked at how an ageing population can impact government debt. To conclude this series, we discuss the impact demographics may have on inflation, growth, rates and what we expect to play out over the next seven years.
Given the effects of demographic changes on economic variables and the wide differences in working-age population growth over the past seven years, there should be clear differences in economic performance.
In terms of GDP growth, Chart 1, which shows average levels of GDP growth since 2011 against the total change in working age population, reveals that countries in the top right corner (Australia, Canada and the United States) have seen strong working age population growth and subsequently relatively strong GDP growth. The countries in the bottom left corner (Japan, Spain and Italy) have seen their working-age populations decline and subsequently achieved low levels of economic growth. This distribution highlights the importance of working age populations on economic growth, as countries with growing population bases have shown an ability to outperform their peers.
Chart 1: Working age population growth and GDP
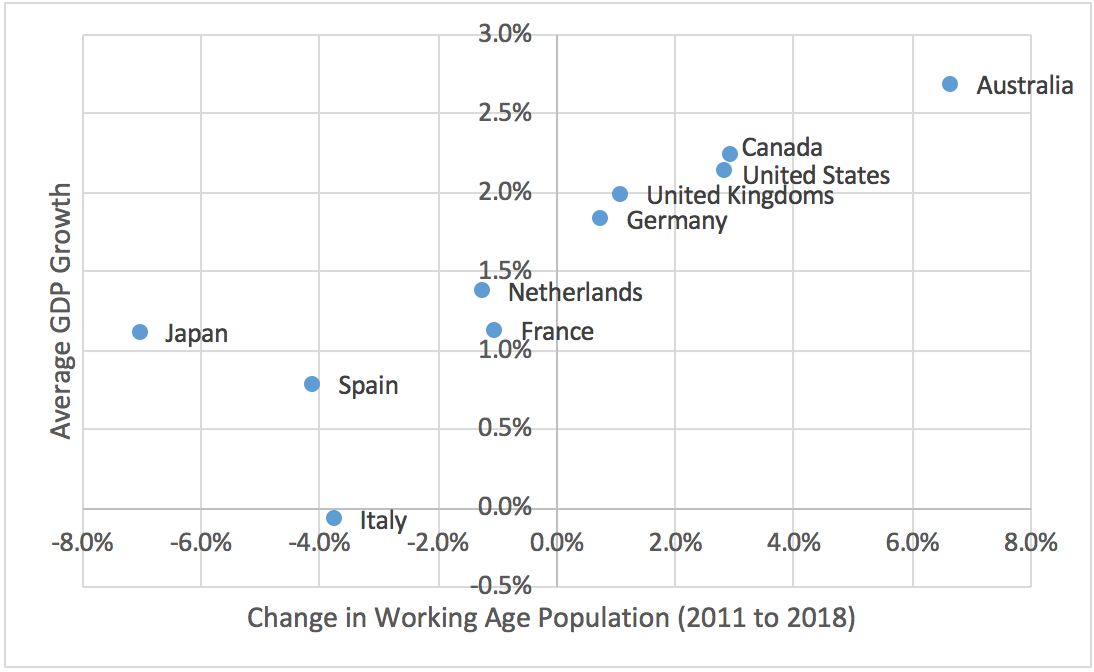
Source: Bloomberg, United Nations DESA Population Division
This analysis can be taken one step further by adding the observed outcomes from 2000 – 2007 for the same countries, a period when working-age population growth was positive. In the charts below the blue dots represent the outcomes from 2011 to 2018, while the orange dots represent the outcomes from 2000 to 2007.
When adding in the observations from the prior decade for GDP growth, the distribution retains its tight upwards sloping shape. That is the higher the working age population growth the greater level of GDP growth achieved, regardless of the decade it occurred. This should not be surprising given that GDP is a function of the number of people available to work in an economy. Over the past seven years the working-age population growth in the developed world has shifted lower, dragging down growth rates from an average of 2.4% to 1.5%.
Chart 2: Working age population and growth
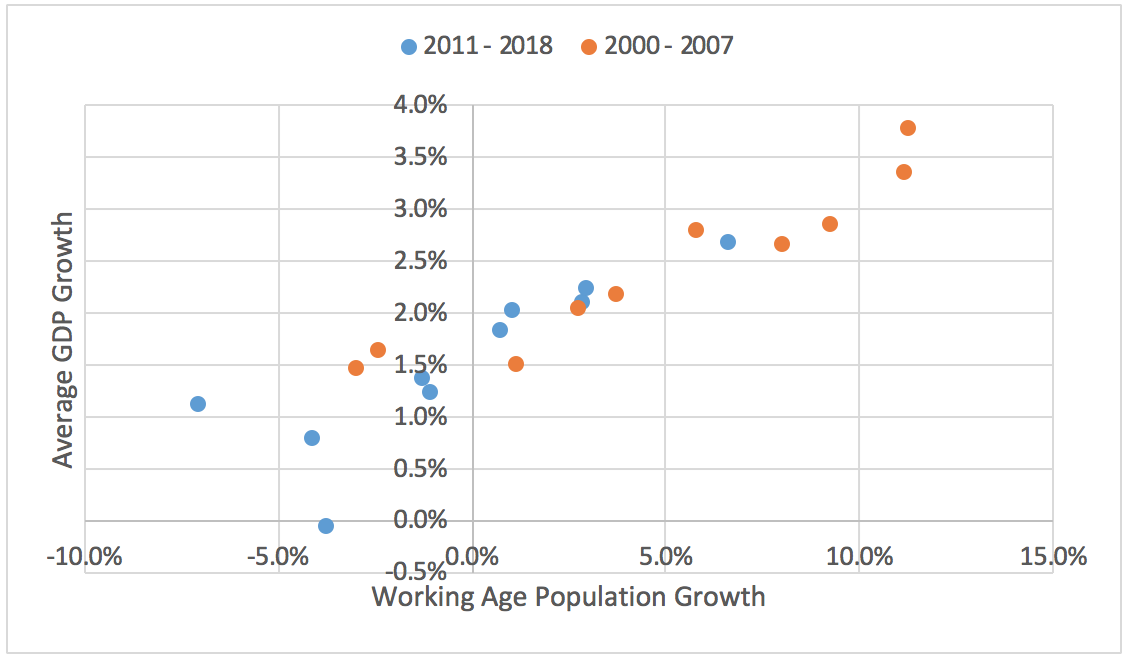
Source: Bloomberg, United Nations DESA Population Division
Two observations stand out here. Firstly those countries that achieved 0 – 5% total growth in the working-age population, whether in the 2000s or in the 2010s, have seen average GDP growth rates of around 2% p.a. This has occurred across decades and within different countries, as the later set includes Canada, Germany, US and UK while the former set includes France, Italy and the Netherlands. In addition, the countries to the right of this box all achieved stronger average economic growth, while those to the left of the box all averaged below 2% growth.
Chart 3: Working age population and growth
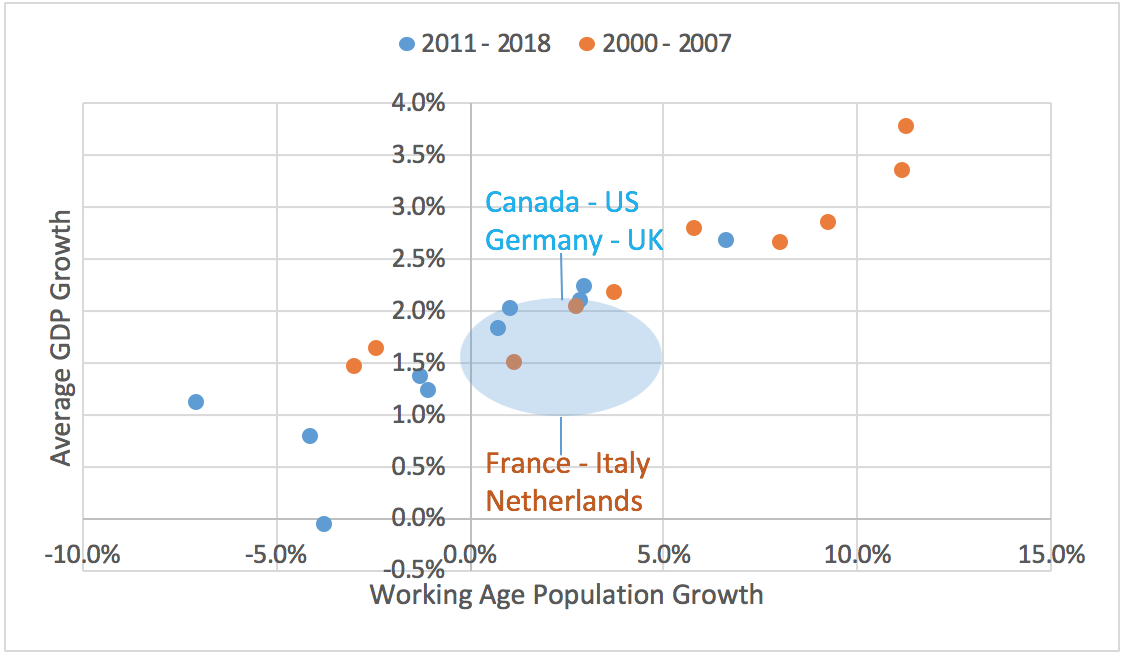
Source: Bloomberg, United Nations DESA Population Division
The second observation is the parallel between Australia and Spain could not be greater. From 2000 to 2007 both countries boasted large increases in their working-age populations with rates of growth above 3%. However, since 2011 the fortunes of each country have shifted dramatically — the Spanish working age population has declined by 4% while Australia’s expanded by over 6%. This has seen Australian GDP average 2.5% over this period, remaining one of the fastest growing developed economies in the world. Spain, however, suffered a fall from grace achieving less than 1% growth on average over the past seven years.
Chart 4: Working age population and growth – Australia and Spain
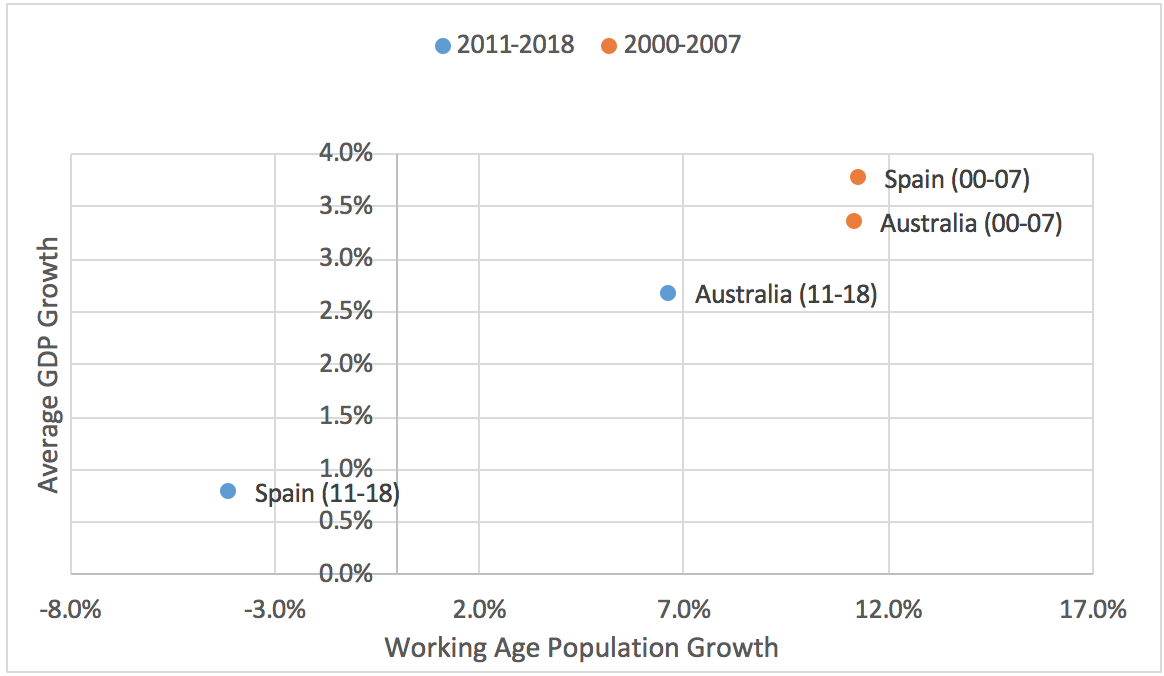
Source: Bloomberg, United Nations DESA Population Division
The rise and rise of population and inflation
Similar to growth, the effects of the change in working age population can also be seen on inflation. The average inflation rate of those with rising working age populations has typically been more positive than those with negative working-age populations. While the results in this scatter plot are a little more varied, it depicts that on average the countries with good working-age population growth will outperform those that are seeing declines.
Chart 5: Working age population growth and inflation
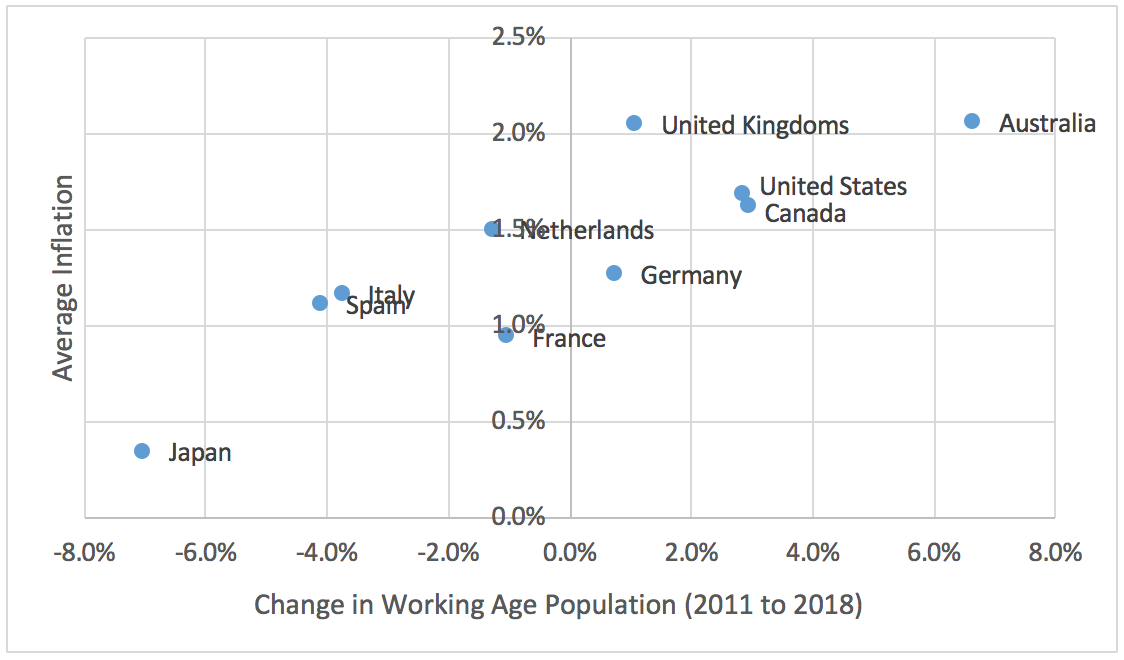
Source: Bloomberg, United Nations DESA Population Division
While not quite as strong as the growing relationship, the same pattern holds when examining rates of inflation through time. The stronger working-age population growth of the early 2000s brought with it higher inflation, particularly in those countries with the largest increase in the working age population. The countries with negative working-age population growth, whether in the 2000s or 2010s, have seen sub 2% inflation and in some cases deflation. Just like economic growth, the entire distribution has shifted down and to the left, as lower working-age population growth has, on average, meant lower levels of inflation across the developed world.
Chart 6: Working age population and inflation
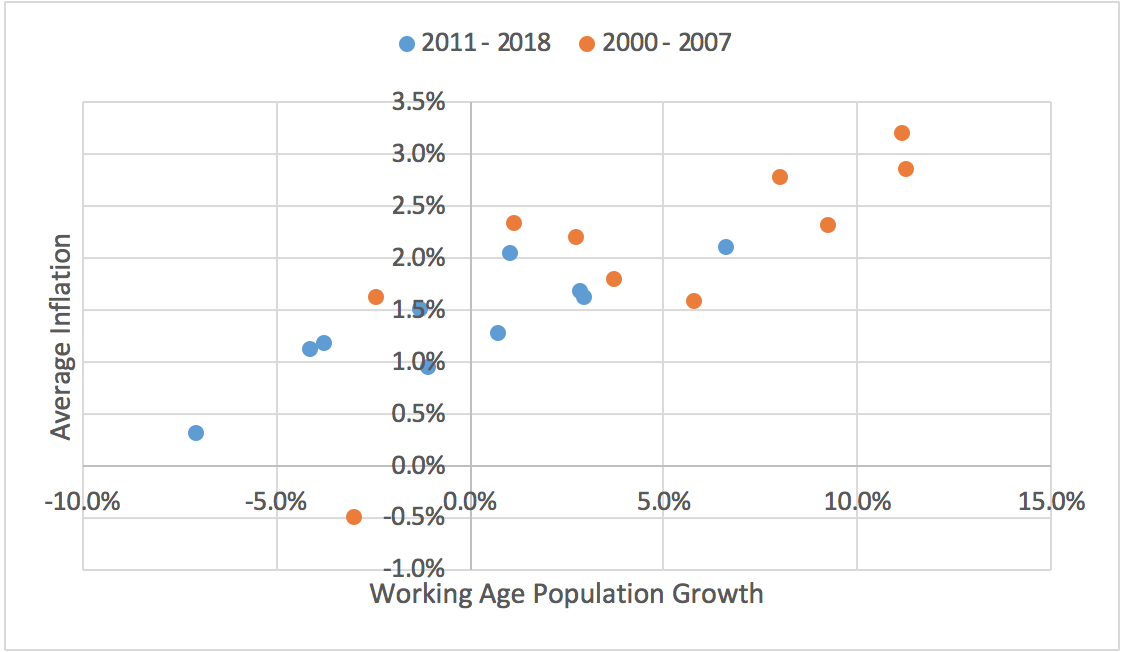
Source: Bloomberg, United Nations DESA Population Division
Over the past five years, policymakers have frequently questioned what has caused inflation and growth to be lower than expected despite the extremely aggressive monetary policy. This breakdown of economic statistics against working-age populations raises the prospect that a very simple answer is the problem: working-age populations have started declining.
Demographics attract a lot of interest
Given the links between the working age population growth and economic performance, it should come as no surprise that demographic factors also have a strong relationship with interest rates. This is most obviously seen in countries that exhibit negative working-age population growth, as those central banks (Bank of Japan and European Central Bank) have been the most aggressive in easing monetary policy. Conversely, the countries with positive working-age population growth have been able to achieve higher levels of growth and inflation, bringing with it a higher interest rate structure.
Chart 7: Working age population and the cash rate
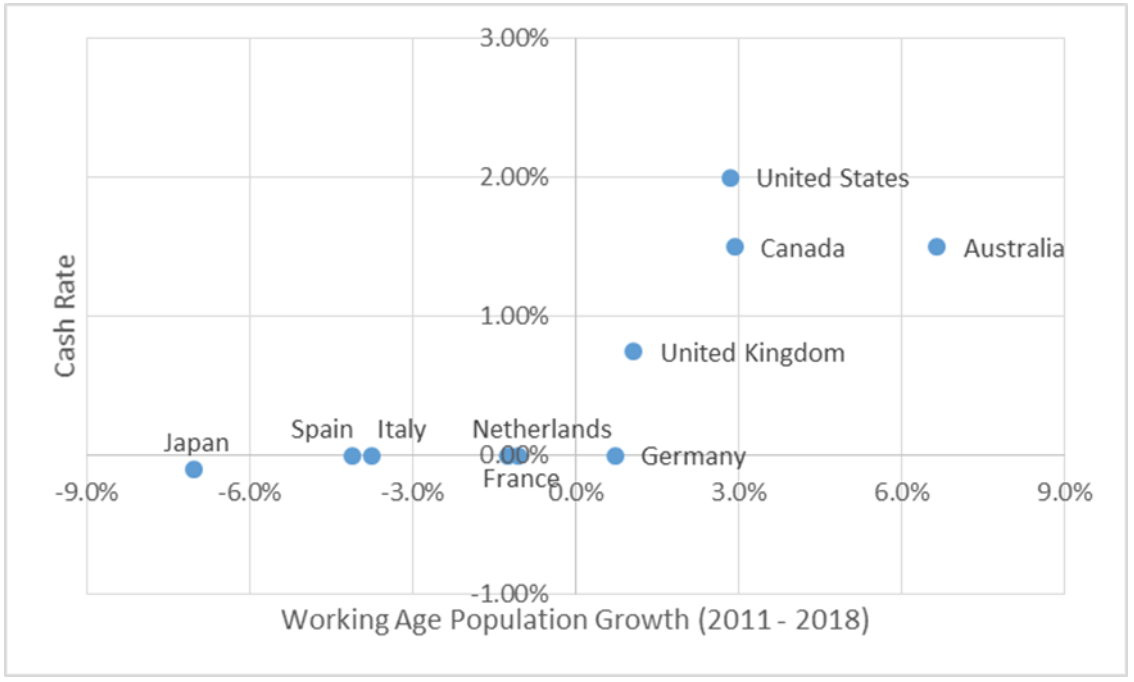
Source: Bloomberg, United Nations DESA Population Division
In light of the demographic effects on growth and inflation, it seems that the countries with negative working-age population growth are fighting against father time. In these countries, interest rates have been moved to negative levels in order to encourage growth, which will offset the drag of having fewer people available for work. Whether or not this is a correct response to declining working-age populations remains to be seen and requires a larger discussion to describe its effects.
The outlook for the next seven years
From a demographic perspective, the next seven years are going to produce similar economic challenges to the past seven, with only the United Kingdom expected to see a higher rate of working age population growth compared to the period 2011 – 2018. By and large, the country set retains its ordering with Japan and European countries exhibiting negative working-age population growth, and Australia, US, Canada and UK showing positive growth. However, only Australia is expected to see even modest growth (at approximately 5%), while the United States, Canada and UK fall somewhere between 0 – 2%.
These estimates raise the notion that for developed economies to come close to their pre-global financial crisis levels of growth, two objectives should be encouraged. Firstly governments must better tap into the parts of their population that are currently not working, e.g. encourage people to retire later and/or encourage greater female employment, and secondly focus on reforms to improve productivity growth. Both of which will require proactive government policy as the Japanese experience shows that neglecting these facts can cause government debt to grow quickly and growth to be anaemic.
Further insights
For additional analysis and insights from the team at Nikko Asset Management, please visit our website.
Never miss an update
Enjoy this wire? Hit the ‘like’ button to let us know.
Stay up to date with my current content by
following me below and you’ll be notified every time I post a wire
Chris is responsible for portfolio management, including portfolio construction and trading for various Australian fixed income portfolios including the Nikko AM Australian Bond Fund at Yarra Capital Management (Nikko AM was acquired by Yarra Capital Management in April 2021). Chris has over 9 years of experience in the fixed income market. He is also co-host of the popular Australian podcast series The Rate Debate.

3 topics
Chris Rands
Co-Portfolio Manager, Fixed Income
Yarra Capital Management
Chris is responsible for portfolio management, including portfolio construction and trading for various Australian fixed income portfolios including the Nikko AM Australian Bond Fund at Yarra Capital Management (Nikko AM was acquired by Yarra...
Expertise
Comments
Comments
Sign In or Join Free to comment