The ASX cracks 8,000 for the first time. How do we get to 9,000?
The ASX 200 has hit several all-time highs in 2024 but it's the most recent one that has investors the most buzzed. Crossing the 8,000 level was key psychologically, and closing above this level means we are also inches away from entering a technical bull market. That is, the ASX 200 is close to experiencing a 20% surge from the October 2023 low.
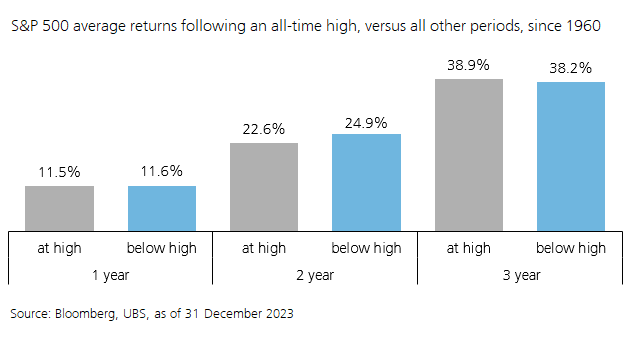
There are many reasons for the ASX 200's rally but one of them has been the strong lead-ins from Wall Street. The S&P 500 has notched up more than 35 all-time highs in 2024 alone. As this chart from UBS Global Wealth Management shows, markets do continue to rally in the months and years following an all-time high, suggesting investors should lean in to an all-time high rather than lean away/sell.

It all sounds really good. It's also all happened really fast. So how does the ASX 200 keep this momentum going? After all, it's hard to gain momentum and can be even harder to keep it there. To answer this, UBS equity strategist Richard Schellbach has penned some key questions that investors and companies need to answer over the next few months.
Still bullish
Schellbach upgraded his ASX 200 target in April, off the back of signs that investors had become relieved over the future path of the Australian economy. Since then, interest rate expectations have been unwound as traders bet that an insurance hike from the Reserve Bank may come as soon as August. That unwinding was sparked by the May monthly inflation indicator, which although only partial, appeared to reveal just how sticky and entrenched services inflation had become in Australia.
But even with that key headwind in place, "sentiment and momentum have driven stocks higher." This, in turn, explains why Schellbach remains bullish but has not changed his year-end target (still 8,000).
ASX 200 Sell-Side Predictions
| Firm | ASX 200 Target |
| VanEck | 8300 (End of 2024) |
| Betashares | 8250 (End of 2024) |
| AMP | 8100 (End of 2024) |
| Morgan Stanley | 8100 (Mid-2025) |
| UBS | 8000 (End of 2024) |
| Barrenjoey | 7300 (Fair value call, as of July 15 2024) |
Source: Livewire compilation, Australian Financial Review
Is our bull market really America's?
Despite his bullish view of the markets, Schellbach acknowledges that equities look expensive. While he believes we are in a bull market, he doesn't see any "euphoria"-type behaviour just yet.
"At 8,000, the ASX 200 sits on a richer than usual valuation multiple, whilst the current dividend yield still seems comparable to history. Bolstering the support for equities is the fact that although both cash and bond yields have risen over the last four years, they don’t offer the attractive pull they once did have against stocks," he wrote.
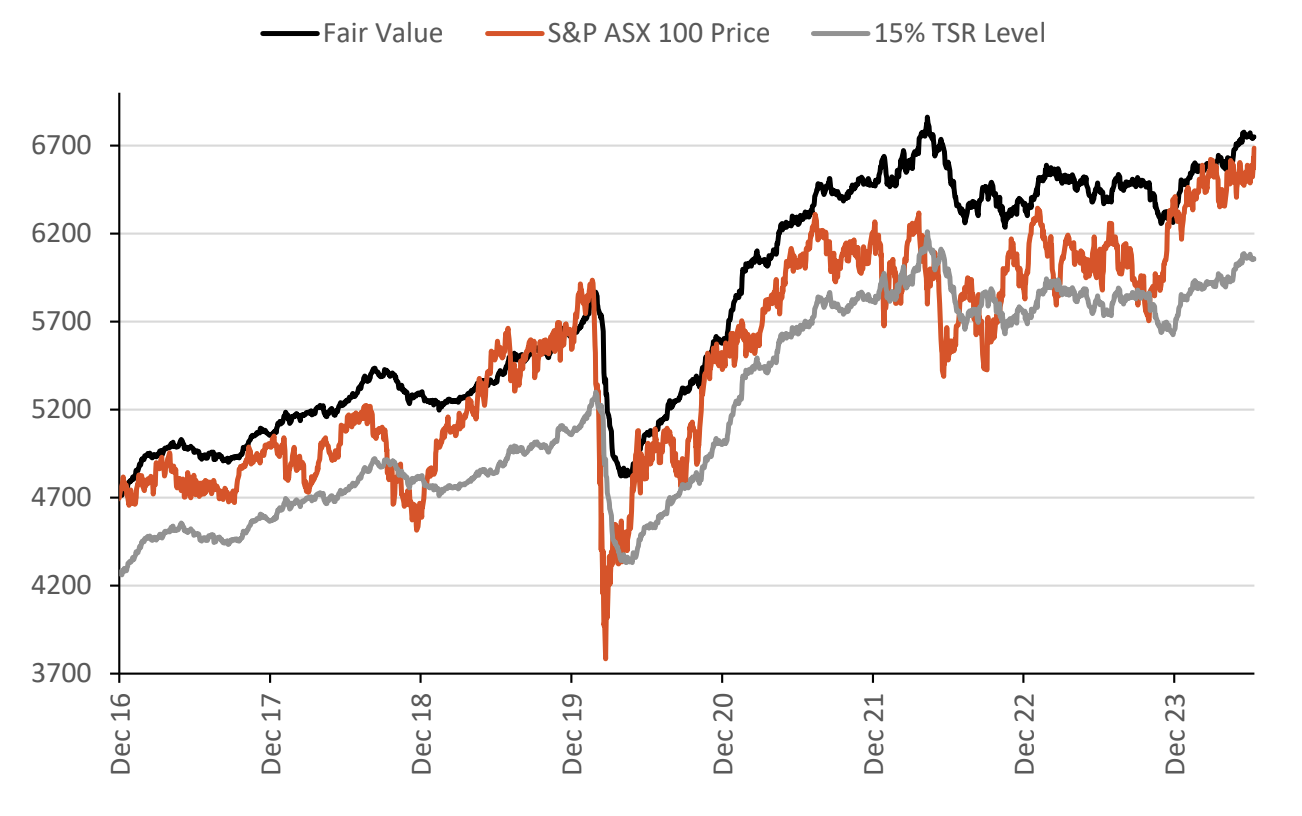
The following chart from Shaw and Partners suggests that the total shareholder return for Australian large-cap stocks is around 4.5% - which is ironically where the ASX 200 dividend yield is sitting. But Shaw and Partners CIO Martin Crabb say that this figure is a "clear" sign "that market leadership is being led by the US market and its earnings trajectory rather than the Australian market and its."
In other words, Shaw says the ASX 200's bull market and all-time high is more a function of America's run rather than anything remarkable we've done.

In the US, intense stock market concentration is often touted by the bears as a key reason why they believe equities are due for a correction. But you can't use this argument in Australia, for the simple reason that the stock market's composition has barely changed since 2000.
"Currently the Top 5, Top 10, and Top 20 companies hold about the same market cap weight within the ASX200 as they have since the year 2000," he said.
What are stocks valued at?
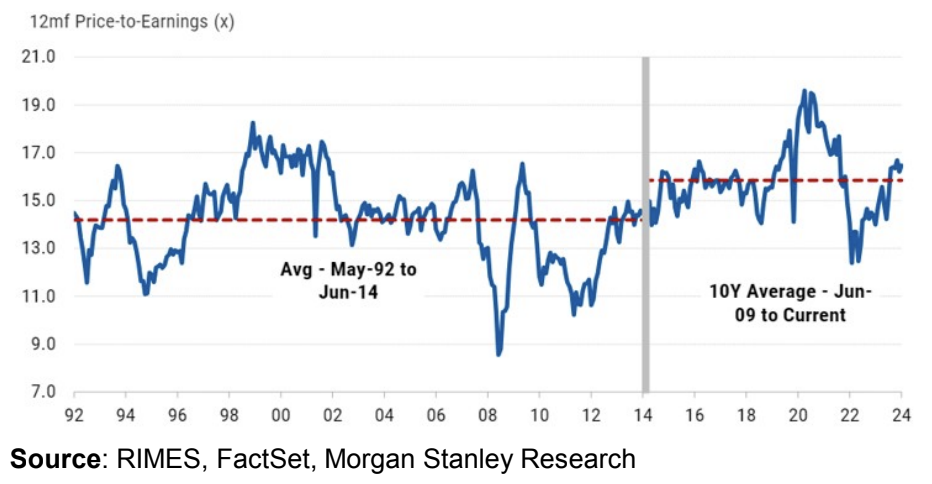
Australian stocks are, relative to their own history, expensive. The trailing P/E of the ASX 200 is 24.33, and the forward P/E projection is around 16.22. You can see how this 16.22 figure stacks up relative to history in the following Morgan Stanley chart:

But UBS is keen to remind us that that is the case all over the world.
UBS also use another measure, the CAPE ratio (sometimes called the cyclical P/E ratio), to argue that valuations are not in a bubble.
Now, the big "If"
The next catalyst for a big move either way is the August reporting season. The big question here is whether profit margins have troughed and if the outlook from corporates can sound better than it has in recent seasons. Here's what Schellbach has to say about that:
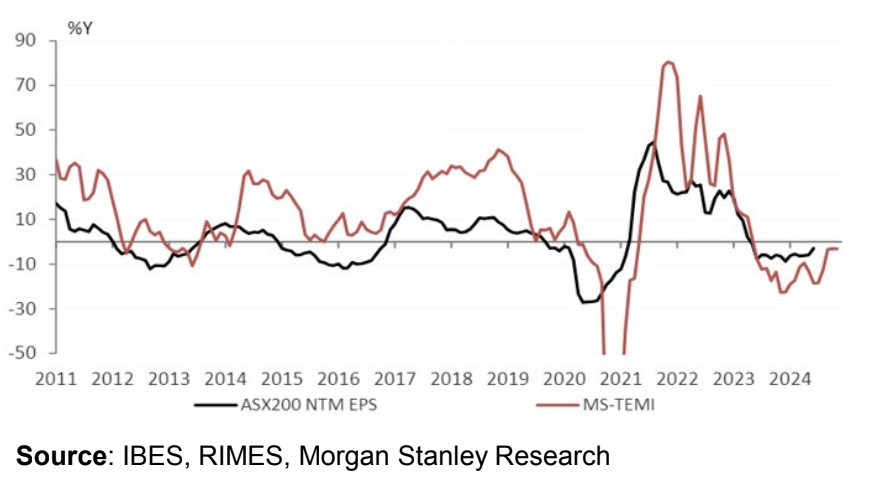
Morgan Stanley seems to agree. Its top-down earnings model suggests that a trough is forming for Australian corporate earnings.

2 topics

