The Goldilocks of dividend income
Interest rates have been on a secular decline for 3 decades dropping from midteen interest rates in 1990 to below 1% in a post pandemic world. By contrast equity dividend yields have been much more consistent averaging 3.93% in the last 30 years. The coronavirus pandemic and economic slowdown has impacted equity dividend yields with the current yield dropping to 3.6% on 10 September 2020. Despite this drop they remain significantly above those of the 10 year bond yield of only 0.93%. On a relative basis this makes equity yields more appealing for investors but it does not come without risk.
Figure 1. Low rates maintain the appeal of equity income
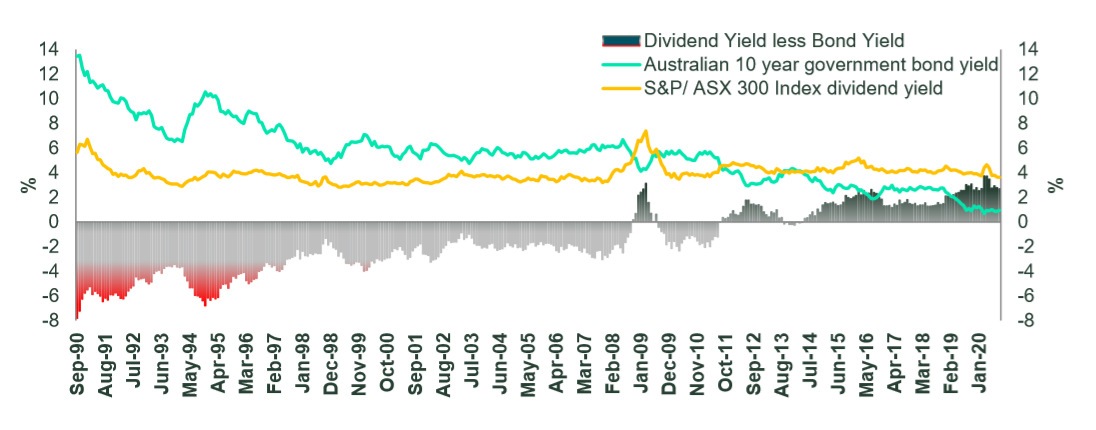
Source: Thomson Reuters, State Street Global Advisors as at 31 August 2020. Past performance is not a reliable indicator of past performance.
Despite dividend cuts, equity dividend yields remain attractive
As shown in the left hand chart in Figure 2 below, the pandemic has seen significant lowering of earnings and dividends across the majority of S&P/ASX 300 Index companies. The median decline in expected earnings per share for the next twelve months (NTM) was 15% and the median decline in dividends per share (NTM) was 18%. As at the end of August the S&P/ASX 300 Index price was down 18% from its pre pandemic high.
The reduction in dividends per share is mostly due to lower expectations for revenue and earnings and surplus cash, but it is also partly due to some corporates being conservative and keeping some powder dry for the uncertainty ahead. Figure 2 shows the Energy sector has seen expectations for dividends decline by more than declines in earnings. In contrast the Utilities sector has seen only small declines in dividend expectations despite larger downgrades to earnings over the next 12 months. Health care has been conservative guiding for lower dividends despite only modest declines in earning expectations. Despite the hits to earnings and dividends, the opportunity for dividend income remains positive.
The dividend yield for the S&P/ASX 300 Index has declined from 3.9%4 to 3.6% but when we look across the S&P/ASX 300 Index sectors, we still observe many reasonable dividend yields available for equity investors. The right hand chart in Figure 2 compares the yields on offer pre and post the economic shock of the pandemic. As at the 31 August 2020 the Utilities sector was offering yields of 5.1%, very similar to that offered pre pandemic. The yield available to financials has come down 18% but still offers yields of 4.6%.
Figure 2. In most cases the declines in earnings have corresponded with similar declines in expected dividends
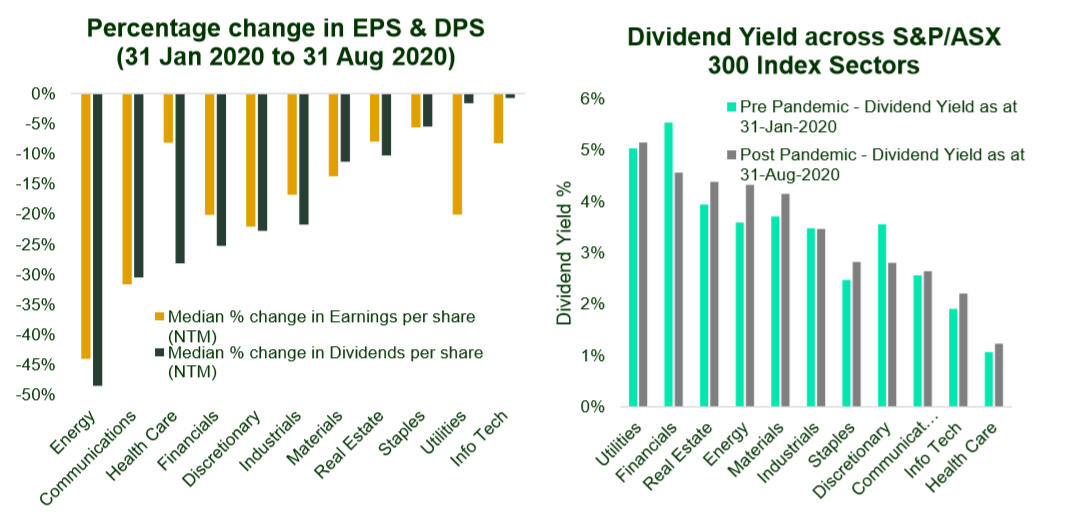
Source: Refinitiv, SSGA, as at 31 August 2020. This information should not be considered a recommendation to invest in a particular sector or to buy or sell any security shown. It is not known whether the sectors or securities shown will be profitable in the future
Beware: Higher income often comes with greater risk
Not all income opportunities are equal and looking at yield alone can be quite misleading. We believe that if a company is yielding more than 8% in the current environment, it is likely to be associated with the risk that the security will see earnings declines and or dividend cuts. The highest yielding stocks are sometimes referred to as “value traps”. On the surface they appear cheap but instead continue to become even cheaper. We take a closer look by examining some of the characteristics of higher yielding companies in the S&P/ASX 300 Index as at 31 August 2020.
Figure 3. Fundamental characteristics associated with different levels of dividend yield
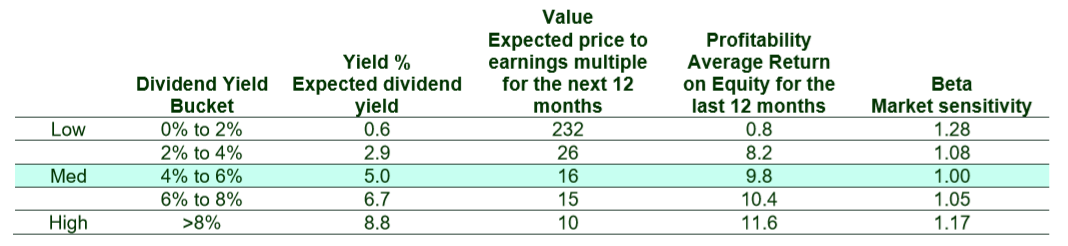
Source: Refinitiv, SSGA, as at 31 August 2020
As you would expect, the lowest yielding companies are often considered the most expensive. As the table above highlights, the lowest yielding companies in the S&P/ASX 300 Index trade at an average of 232 times next year’s earnings. By historical standards these multiples are very high and symptomatic of the extreme market environment we are observing. On average this low dividend cohort has delivered the least in terms of operating returns in the last 12 months as represented by the return on equity. It is also the most volatile and as illustrated by the average beta of 1.28. In recent weeks this volatility has been generating front page headlines. At the other extreme, the highest yielding companies are the second most volatile cohort with an average beta of 1.17. So where is the sweet spot for income investors?
The Goldilocks of Dividend Income: “Not too high and not too low”
We look to invest in companies that are expected to have the highest returns for the lowest expected risk looking forward. These companies are expected to have a stable growth outlook, a higher quality business and reasonably valued. We tend to avoid holding the more risky extremes found in both the highest yielding and lowest yielding securities. Not too “hot” and not too “cold”.
Figure 4. State Street Australian Equity Fund exposure to dividend yield
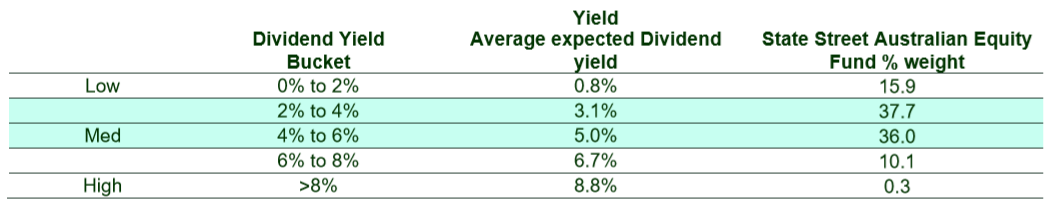
Source: Refinitiv, SSGA, as at 31 August 2020. Weights are as of the date indicated and subject to change.
Learn more
Stay up to date with our latest thoughts by clicking follow below and you'll be notified every time we post content on Livewire.
Never miss an update
Enjoy this wire? Hit the ‘like’ button to let us know.
Stay up to date with my current content by
following me below and you’ll be notified every time I post a wire
Bruce is Head of Active Quantitative Equity - Australia, for State Street Global Advisors. He has over 20 years' experience, covering Australian and global equites, long and short equities as well as global macro strategies.
........
Issued by State Street Global Advisors, Australia Services Limited (AFSL Number 274900, ABN 16 108 671 441) (“SSGA, ASL”). Registered office: Level 14, 420 George Street, Sydney, NSW 2000, Australia · Telephone: +612 9240-7600 · Web: www.ssga.com. State Street Global Advisors, Australia, Limited (AFSL Number 238276, ABN 42 003 914 225) (“SSGA Australia”) is the Investment Manager. Investors should read and consider the relevant Product Disclosure Statement (PDS) for a Fund carefully before making an investment decision. A copy of SSGA’s Managed Fund PDSs are available at www.ssga.com.au This general information has been prepared without taking into account your individual objectives, financial situation or needs and you should consider whether it is appropriate for you. You should seek professional advice and consider the product disclosure document, available at ssga.com, before deciding whether to acquire or continue to hold units in the Funds. The views expressed in this material are the views of the SSGA Australian Active Quantitative Equity Team through the period ended 8 April 2020 and are subject to change based on market and other conditions. The information provided does not constitute investment advice and it should not be relied on as such. All material has been obtained from sources believed to be reliable, but its accuracy is not guaranteed. This document contains certain statements that may be deemed forward-looking statements. Please note that any such statements are not guarantees of any future performance and actual results or developments may differ materially from those projected. Volatility management techniques may result in periods of loss and underperformance, may limit the Fund's ability to participate in rising markets and may increase transaction costs. Actively managed funds do not seek to replicate the performance of a specified index The fund is actively managed and may underperform its benchmarks. An investment in the Fund is not appropriate for all investors and is not intended to be a complete investment program. Investing in the Fund involves risks, including the risk that investors may receive little or no return on the investment or that investors may lose part or even all of the investment. Standard & Poor’s and S&P are registered trademarks of Standard & Poor’s Financial Services LLC (“S&P”) and Dow Jones is a registered trademark of Dow Jones Trademark Holdings LLC (“Dow Jones”) and have been licensed for use by S&P Dow Jones Indices LLC and sublicensed by SSGA. The S&P/ASX 300 Index is a product of S&P Dow Jones Indices LLC, and has been licensed by SSGA. SSGA’s Funds are not sponsored, endorsed, sold or promoted by S&P Dow Jones Indices LLC, Dow Jones, S&P, their respective affiliates, and none of S&P Dow Jones Indices LLC, Dow Jones, S&P, nor their respective affiliates make any representation regarding the advisability of investing in such product(s). Investing involves risk including the risk of loss of principal. Risk associated with equity investing includes stock values which may fluctuate in response to the activities of individual companies and general market and economic conditions. This material should not be considered a solicitation to apply for interests in the Funds and investors should obtain independent financial and other professional advice before making investment decisions. There is no representation or warranty as to the currency or accuracy of, nor liability for, decisions based on such information. The whole or any part of this work may not be reproduced, copied or transmitted or any of its contents disclosed to third parties without SSGA Australia’s express written consent.

2 topics

Head of Portfolio Management – Australia, Active Quantitative Equity
State Street Global Advisors
Bruce is Head of Active Quantitative Equity - Australia, for State Street Global Advisors. He has over 20 years' experience, covering Australian and global equites, long and short equities as well as global macro strategies.
Comments
Comments
Sign In or Join Free to comment