The illusion of 'risk-adjusted' returns
Quite rightly, there is a big focus on risk-adjusted returns in financial markets. A prospective 10% return which requires bearing significant risk can be correctly considered inferior to an 8% prospective return achieved taking very little risk.
The variance in prospective return and the potential risk to capital in the former case has likely been insufficiently compensated through the additional return offered. The problem is, how is risk to be measured and compared. As William Bruce Cameron wrote, “Not everything that can be counted counts. And not everything that counts can be counted.” There is no accurate way to measure risk, only substitutes. These substitutes can be useful guides, but they have limitations.
In 1966 William F. Sharpe developed a formula for measuring historical risk adjusted returns, the Sharpe ratio, that has since become the norm in financial markets. The Sharpe ratio is defined as follows:
Sharpe Ratio = (Portfolio Return - Risk Free Rate) / Portfolio Standard Deviation
The numerator calculates the excess return that has been generated over a risk free return that was available, typically assumed to be the return on a Government bond. The denominator is the standard deviation of the value of the asset. The implicit assumption in the equation is that the way the price of an asset moves around is a proxy for the risk involved in holding that asset. Other measures, such as the Sortino ratio, the Treynor ratio, and upside and downside capture measures have since been developed. But all make a similar assumption, that the volatility in the price of an asset is equivalent to the risk of the asset.
Naturally, there are a number of problems with this assumption. Different markets have different types of participants and trade with varying frequency. An asset that trades infrequently and only in large parcels and between sophisticated parties, or potentially does not trade at all but is valued based on a consistent valuation methodology adopted by experts, valuers or directors will, definitionally, exhibit significantly less volatility than the exact same asset traded in public markets by millions of participants with a wide range of expertise, from the complete novice to the institutional investor, especially if they all have different time horizons, objectives and behavioural biases.
The fact that the one asset might exhibit very different levels of volatility depending on how, when, how often and by whom it is bought and sold should naturally generate caution about the use of such ratios. But in a world obsessed with measurement and full of smart managers selling financial products, sometimes the opposite occurs. The primary investment focus becomes the financial ratios and so the tail can end up wagging the dog.
Two obvious outcomes from focusing heavily on financial ratios are evident to us.
The first is a trend towards benchmark hugging for participants within publicly traded markets. Investing differently to the market might put your risk-adjusted returns at risk in two ways. Your returns might be lower at certain times and your measured volatility is likely to be higher. The risk of not owning the largest companies in a particular market may result in negative variance in returns for the active manager. But more importantly, there are more buyers and sellers of larger listed companies, and so the price variability that these companies experience is often lower than smaller companies. This is becoming increasingly the case with so much passive capital continuously flowing into listed markets. Larger companies tend to be less volatile in price, irrespective of the direction of underlying earnings. And the inverse is also true, with stocks that are less well held often likely to be more volatile.
Within the Australian equities market, the six largest companies in the All Ordinaries Index are as follows:

As the chart below demonstrates, the banks have seen virtually no earnings growth over the last decade.

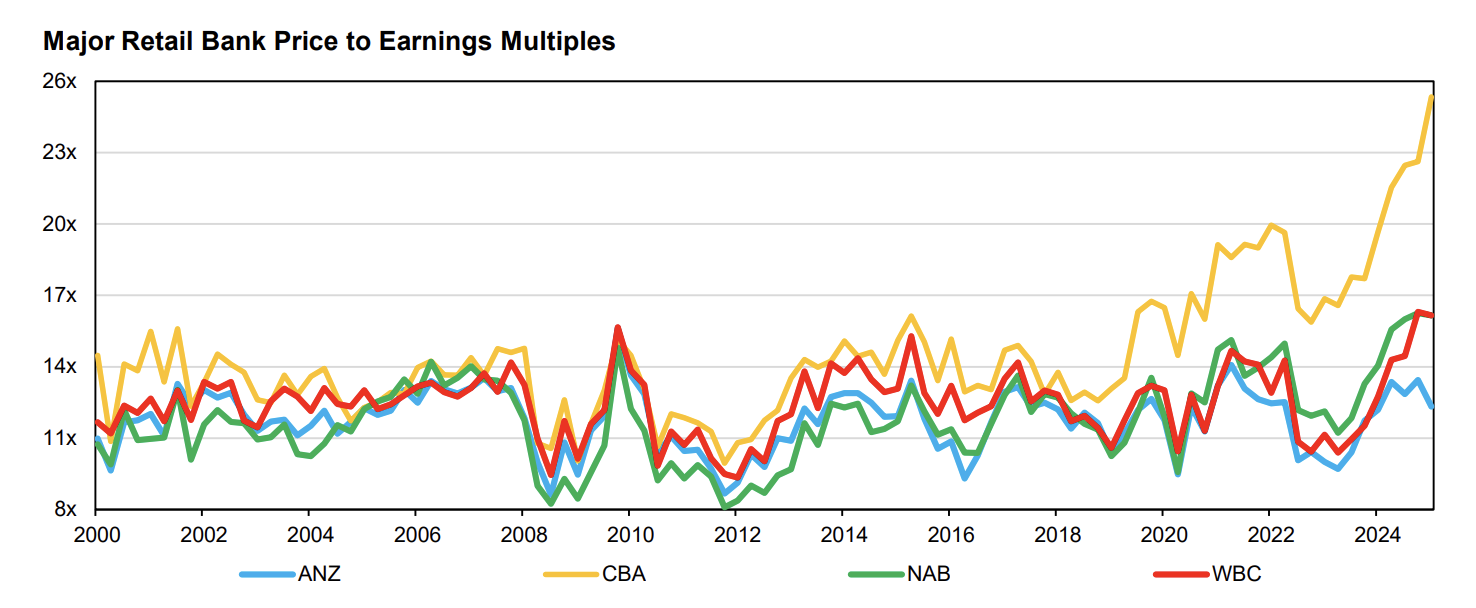
With very little earnings growth, their strong share price performance in 2024 was the result of investors paying more for a similar level of earnings, such that bank multiples of earnings are now close to record levels.

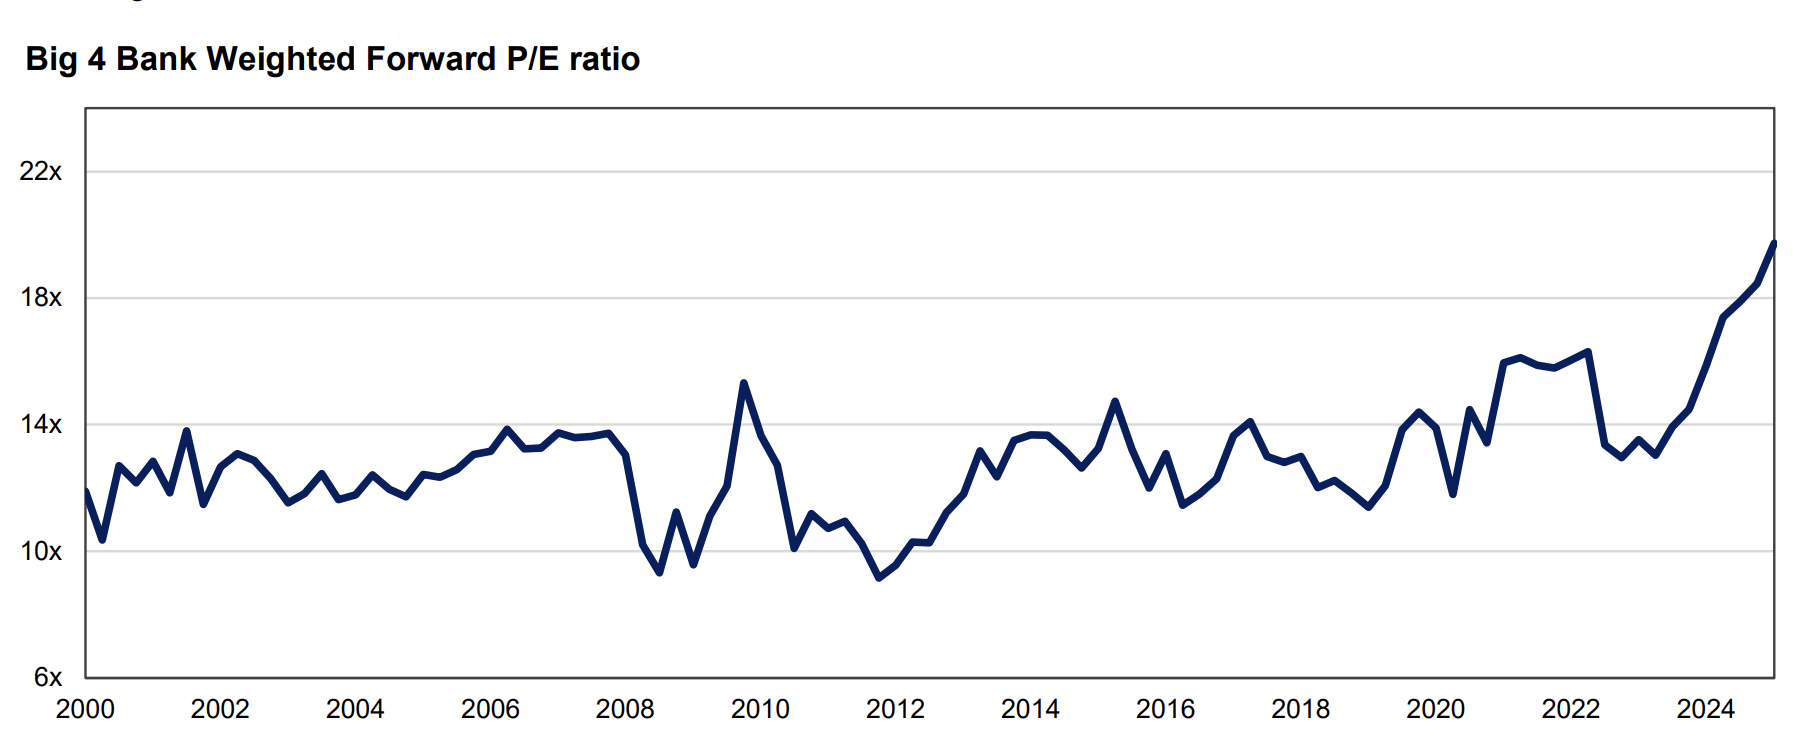
If you own the four banks in proportion to their current market capitalisations, the multiple of earnings you are now paying is the highest on record.

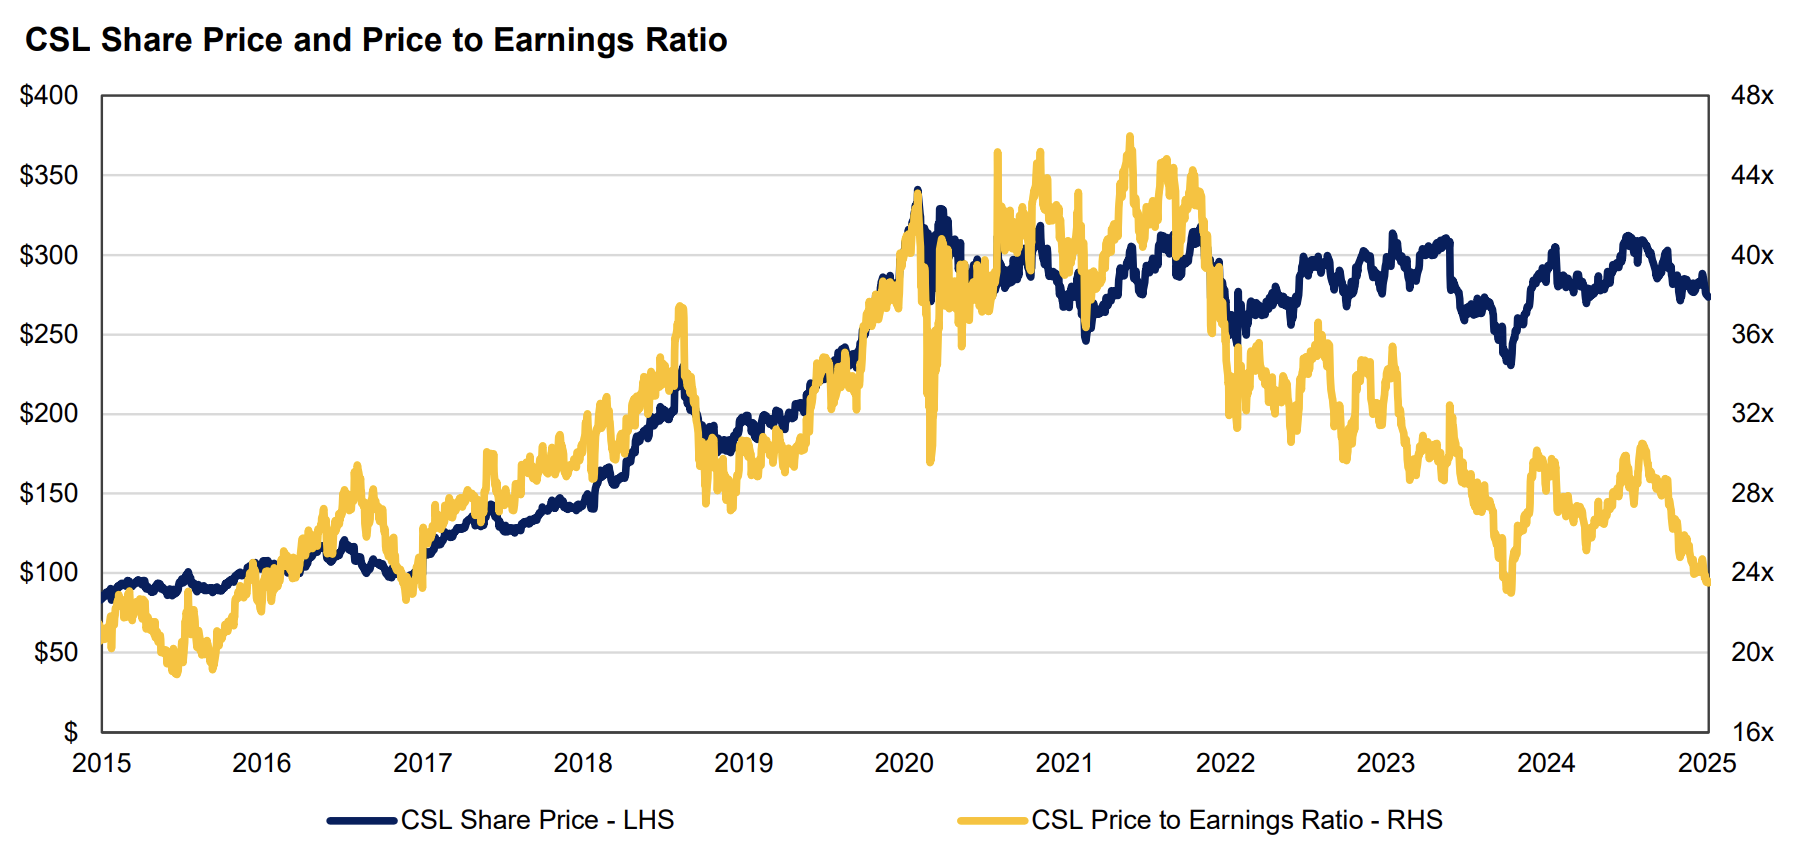
Meanwhile, BHP is facing declining steel consumption in China which makes generating earnings growth on a go forward basis a challenging proposition. And CSL’s share price has barely moved over the last 5 years, generating a compound return of 0.7% per annum including dividends, largely because of its extended multiple in 2020, as can be seen below.

Incredibly, these six stocks represent 32.6% of the All Ordinaries Index and 37.1% of the ASX200 Index. Most domestic managers that invest across the spectrum of stocks from large to small have roughly one third of their portfolios invested in these names or, at the very least, significant exposure to most of them. Yet we doubt many would justify holding such large weights in companies, which excluding CSL are expected to deliver anaemic or potentially even negative earnings growth over coming years, at these weights absent the index composition, especially since the banks in particular are trading on extended multiples.

The last 12 months illustrates the short term difficulty of investing based on expected return measures, rather than relative to an index, for active managers. The banks, which collectively delivered negative 5.1% NPAT growth in FY24 and are expected to deliver 2.8% NPAT growth in FY25, are currently collectively trading on 19.7x forward earnings. This is the highest collective multiple the banks have traded on in at least the last few decades. Despite the lack of earnings growth, the banks were responsible for approximately 53% of the performance of the All Ordinaries Index. For managers of publicly listed capital, not owning the largest companies will often increase the volatility of performance. In 2024 it also made generating outperformance a very difficult exercise.
We can attest to this. Auscap’s High Conviction Australian Equities Fund held none of the four banks mentioned for the year. It generated a gross return of 11.4%, in line with the index, which was only achieved through the holdings in the Fund significantly outperforming the non-bank components of the index. Through not owning the banks in that year, it was difficult to just breakeven with the index. So the focus on “risk-adjusted returns”, or more accurately share price volatility adjusted returns, has a natural consequence which is benchmark hugging by active managers, irrespective of whether or not this is justified on a prospective return basis.
The second result from focusing on risk-adjusted financial ratios across asset classes, irrespective of the differences in how they are traded, is a distinct move from public markets to private markets. Warren Buffett famously said “only buy something that you’d be perfectly happy to hold if the market shut down for 10 years.” Investment managers and advisers have taken this advice literally. Capital is flowing from bond managers to private credit providers, from listed equities funds to private equity, venture capital and other unlisted funds. From publicly traded securities involving millions of participants of varying knowledge, sophistication and aptitude trading small parcels thousands of times every business day, to privately traded assets valued in an excel spreadsheet by a director or external valuer typically once a quarter. From asset prices that will move according to investor sentiment, market psychology and the extremes of investor fear and greed, to asset prices that move conservatively when times are good to build in a buffer and barely at all when times are difficult, taking advantage of said buffer. From risk-adjusted return measures that, because of the swings in publicly traded securities, mostly look fairly average, to those which look exceptionally strong.
Of course, it is an illusion. These private assets are not superior to their listed counterparts. We would suggest that many of the best businesses in the world are listed. Infrequently are they in the hands of private funds that manage public capital. We would be astonished to find a private capital vehicle that owns a better selection of businesses than the companies in the two funds that we manage. But comparing “risk-adjusted returns” which are based on price volatility should naturally favour private markets. Private market prices are often done infrequently and based on objective, rational, through the cycle metrics, or worse, participants are allowed to mark their own homework during the journey. Meanwhile, those operating in listed public markets have to deal with the vagaries of sentiment driven prices that can fluctuate wildly at different points in the cycle.
Furthermore, when leverage is employed by publicly listed vehicles it can result in dramatic swings in their share price. This is to be expected. Leverage enhances the return for equity holders but it also increases the risk in the business, and the market typically reflects this in a more volatile share price. By contrast, when leverage is employed by private equity, which it often is, it has the effect of boosting the returns if the value of the asset increases over the duration of ownership, while having little impact on the “volatility” of these returns. Again, this is an illusion; the risk is there, but it is not measured. The only time the public hears about it is when the leverage causes the investment to fail, in which case the equity is typically wiped out. It is unsurprising in this comparison that there is a move towards private capital vehicles.
There is, of course, a catch. And the catch for private capital is liquidity. Many of the private funds have moved towards enabling investors to come in and out of the fund, but most are reliant on other investors coming into the fund, or a reserve of cash to fund redemptions, to satisfy those wishing to redeem. If something goes wrong, the assets are not easy to liquidate. And of course, if something does go wrong, it should come as no surprise that a lot of people will wish to exit, and very few will be there to replace these investors.
In recent years we have seen a significant increase in private credit funds, private equity funds, unlisted real estate funds and venture capital funds. As more capital chases investment opportunities, privately traded asset prices rise, risks get temporarily ignored and prospective returns decline. Observationally many emerging private credit funds have a short operating history, having commenced operation in a period of relative calm with consistently rising property prices, and have experienced few defaults let alone had to repossess assets. Private equity funds are frequently extending the tenure of their funds due to the absence of opportunities to exit investments as listed markets and trade buyers become more sceptical of the future performance of private equity divestments. Valuation changes that have occurred in listed markets, as seen during COVID-19 and the technology correction in 2022, have not been universally reflected in private asset valuations, occasionally drawing the attention and ire of the regulator. We suggest caution is warranted.
Our preference is to focus on the underlying earnings of the businesses we invest in, and the risk we focus on as a manager is the expected volatility of earnings. This is actual, rather than perceived, risk. Declining or negative earnings is the predominant cause of investors suffering a permanent loss of capital on an investment. So our first focus is on determining the risk to future earnings for a given company. This dictates a focus on high quality businesses, where we are confident that the business will generate growing earnings over the medium term. The second risk that can cause a permanent loss of capital is paying too high a price for an asset. This is why we adopt a value focused approach, where we look to pay a fair price or better for the investments we acquire.
Investing sensibly is definitionally long-term investing. Particularly in listed markets where the short-term results can often be driven by investor sentiment, human emotions, passive investment flows and other temporary factors that we believe are incapable of accurate prediction. We attempt to use these swings to our investors’ advantage. But over the long term the weight of earnings becomes the powerful primary factor determining share prices and hence investment performance.
Note: This article was first published on 22 January 2025 by Auscap Asset Management. Figures in the article are as at that date and have not been updated for this republication by Livewire.
Invest with Conviction
Auscap Asset Management’s High Conviction and Ex-20 Australian Equities Funds are designed for investors seeking quality businesses with strong growth potential.

