This market is running out of breadth
Everyone knows that Nvidia and AI is the driving force behind the US market reaching record highs.
And everyone knows that the ‘Magnificent Seven’ have (mostly) been the driving force behind the US stock market rally of the past few years.
These ‘leaders’ have dragged most other stocks along for the ride.
Until recently…
Over the past few months, an increasing number of stocks have run out of steam. But the headline indexes (both in the US and here in Australia) have held up.
Fewer and fewer companies are participating in this bull run. This is commonly referred to as ‘deteriorating breadth’.
It’s a condition best illustrated. You can do this in a number of ways. You can look at things like new highs to new lows, or advancing versus declining stocks.
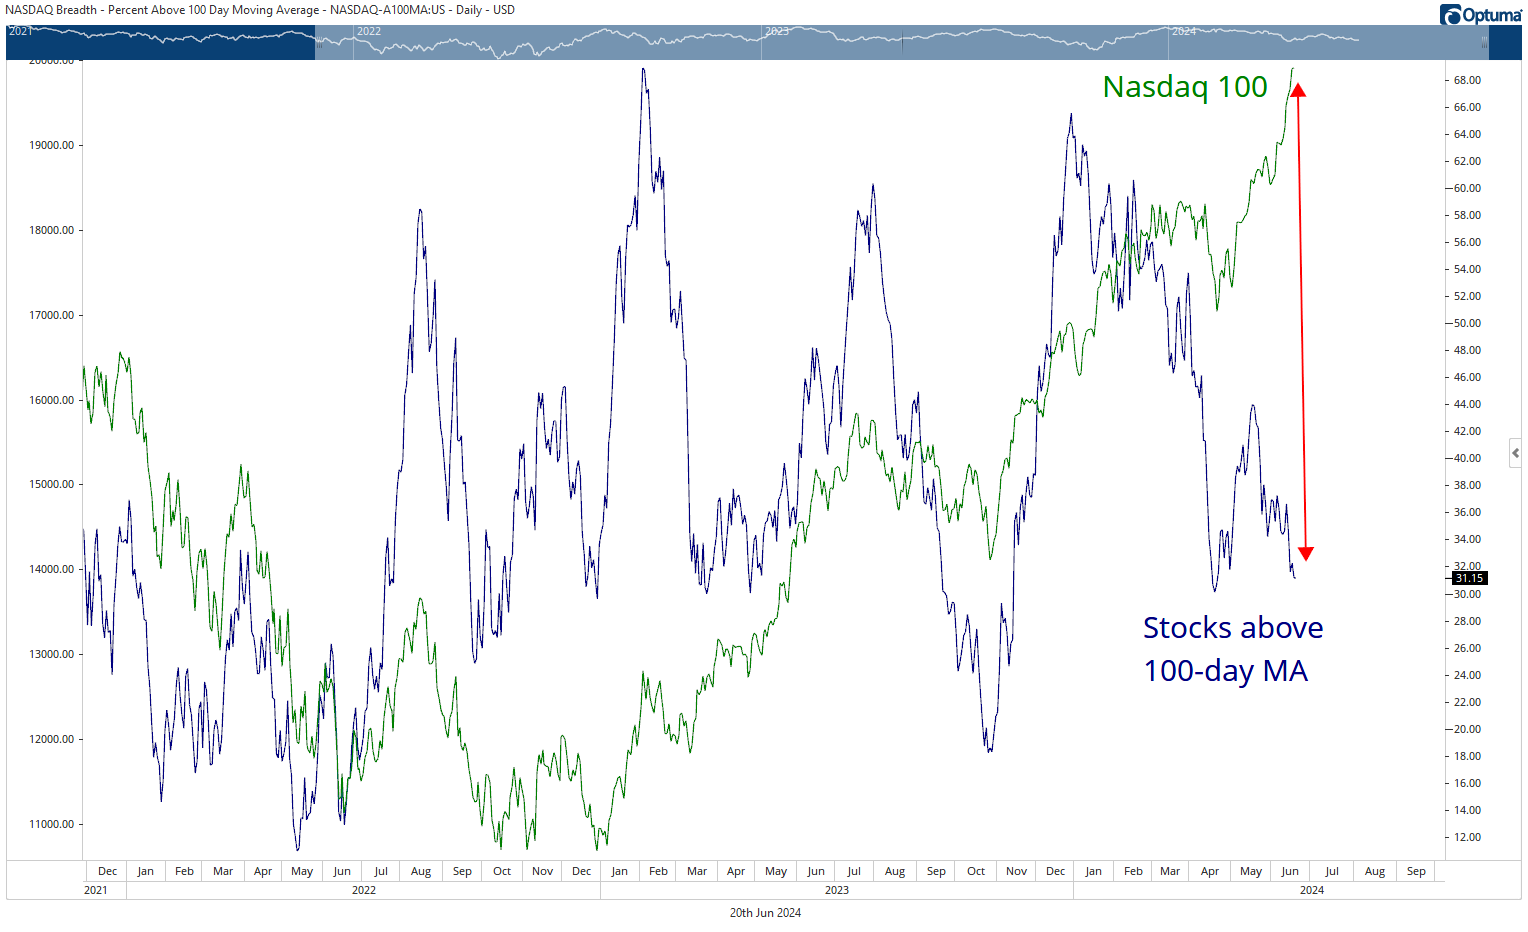
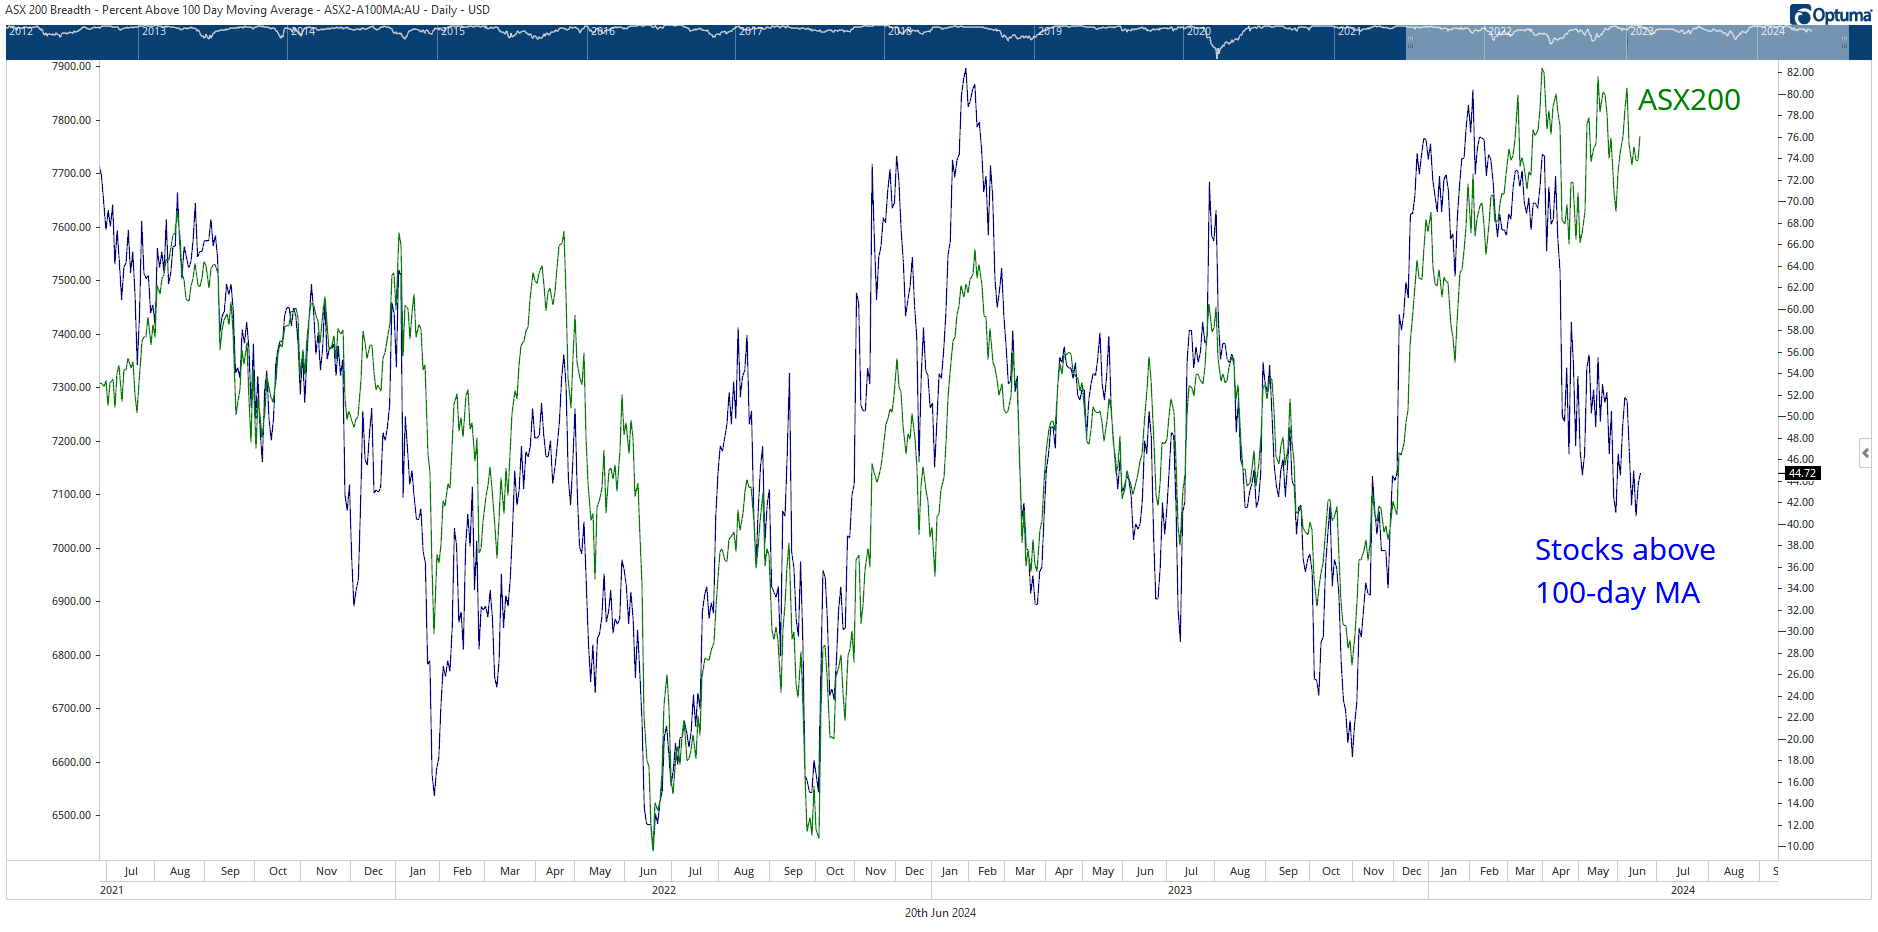
In the charts below, I show the number of stocks trading above their 100-day moving averages compared to the market. 100 days roughly equates to a medium-term trend.
The first chart shows the NASDAQ100 powering to new highs (green line) while nearly 70% of stocks within the index are now below their medium-term trend line.
As you can see, there is now a significant divergence between the headline index and the stocks in the index.
To be clear, this doesn’t mean the market is about to crack. But it is certainly a sign to be cautious. Narrowing market breadth is often, but not always, a sign of looming danger.

It’s a similar situation in the Aussie market. While the gap isn’t as pronounced as the NASDAQ's, the divergence is worrying, given the normally tight correlation between the ASX200 index and the medium-term trend of its constituent stocks.
Since the April correction, the number of stocks trading above their 100-day MA continued to decline, while the index rebounded.
Again, it’s important to emphasise that this doesn’t mean the market will fall. Stocks could stage a rebound and re-establish their medium-term uptrends.

But I think that is a low probability outcome.
Why?
It comes down to the environment for inflation and interest rates.
It’s becoming clear that there is a decent probability that we are in a period of structurally higher inflation.
Structurally higher inflation is a risk to the overall market via a structurally higher risk-free rate.
For the uninitiated, the risk-free rate is the equivalent of a 10-year government bond yield. In Australia right now, it's around 4.2%. To correctly value equities, you need to add an ‘equity risk premium’ to this—usually 4–5%.
That means you should discount the future cash flows you expect companies to produce by AT LEAST 8–9%.
Right now, investors are implicitly not doing this. The Aussie market's P/E ratio (on 17 June) was 19.6x, representing an earnings yield of 5.1%.
In other words, investors are barely pricing in an equity risk premium.
What’s going on?
Are they expecting/hoping for a return to a low inflation environment, which would drive the risk-free rate (and therefore the discount rate) lower?
That’s part of it.
Another explanation is that capital and liquidity are plentiful right now. When there is an excess supply of something, its price, or ‘cost’ falls.
In market parlance, you’re seeing a low cost of equity capital right now, as excess liquidity pushes stock prices higher. The higher the stock price, the lower its cost.
Think of it this way:
Company A trades on a P/E of 20, an earnings yield of 5%
Company B trades on a P/E of 10, an earnings yield of 10%.
Which company has the lower cost of equity?
Company A. It only ‘costs’ Company A 5% to issue new shares, whereas it ‘costs’ Company B 10%.
The rise of ‘dumb money’
So excess liquidity is pushing stock prices higher. You’re especially seeing this in the rise of passive ETF’s. There is a lot of ‘dumb money’ flowing into markets, pushing prices higher irrespective of value.
I don’t mean dumb in a pejorative way. I mean that when someone puts money into the ASX200 a decent chunk of it will buy the banks and other large stocks at any price. This is blind capital.
And it creates large pricing inefficiencies. Look at Commonwealth Bank. It trades on a P/E of 22 times, or an earnings yield of 4.54%.
There is no equity risk premium here. The price is irrational, unless you think CBA is a better risk than the Australian government. (A view that has some merit!)
Bringing it back to the market, as I said we have a current P/E multiple of 19.6. That compares to the 10-year rolling average of 15.55 times. So we’re 25% above the long-term average.
And that past 10 years mostly reflects a period of low interest rates and inflation. In a period of structurally higher interest rates and inflation, what should ‘the market’ P/E be?
I’m not sure, but the probability is that it is lower than where it is now.
The point is, if we are heading into a structurally higher inflation environment, you need to be particularly disciplined when it comes to valuation.
In an era of major energy challenges and excess government spending (leading to poor productivity outcomes) it’s unlikely we go back to a low inflation and rates environment (outside of recession).
Longer-term readers will notice that I’ve changed my thinking on this topic. When central banks sharply increased interest rates throughout 2022 and 2023, I thought the economy would slow rapidly and rates would come back down.
Rates could still fall in the short-term. Monetary policy is certainly restrictive. But rate cuts will only occur in a recessionary environment, which would be a challenge for richly priced stocks.
Even then you still have the problem of a dysfunctional energy system, which will effectively push the cost base of the economy higher over time. And federal and state governments running deficits (despite receiving huge inflows from commodity royalties and high taxes) ensures non-productive demand remains robust.
This makes it very difficult for the RBA. They will not be able to cut as deeply as in past slowdowns. Fiscal is now the dominant policy. And that is long-term inflationary.
Going back to the chart showing deteriorating breadth, in my view, it paints a picture of inflationary conditions producing little real (productive) growth, which hurts margins and profits and leads to weakening share prices.
Meanwhile, the winners from the inflation (the asset rich, debt poor) plough money into passive ETF’s and momentum stocks without a care in the world for the price they’re paying.
While I recognise this is a story I’m telling myself to make sense of the data, it’s a plausible one.
It suggests you need to be diligent on valuation, and listen to the message of the majority of stocks, not what dwindling number of large caps are saying.
Enjoy unfiltered investment analysis? That's just a taste of the daily insights at Fat Tail Daily, covering everything from tech to miners to economic trends. Expand your perspective - subscribe for free here.
4 topics

