TOL - 30th Oct, 2024
Top 12 ASX silver stocks: explorers, developers, and producers
The silver price has surged the past few weeks. We investigate why, how much further it could go, and the ASX stocks that stand to benefit.
This is a refresh of the “The ASX Silver Stocks you absolutely must know about” article I wrote in May where I went through stock by stock…well, the name kinda says it all! That article, which has been viewed over 15,000 times, has served as an excellent reference point for Aussie investors to learn more about this exciting segment of the Australian share market.
Given what’s happened this week with the silver price, I feel it’s a good time to hit refresh on the ASX silver stocks you absolutely must know about, as well as recap some of the reasons why the silver price is rising and how much further it might go. This article should serve as a one-stop shop for everything you need to know about the growing silver opportunity.
Note: In addition to fully updated research on the original stocks from the May article of Adriatic Metals (ASX: ADT), Argent Minerals (ASX: ARD), Andean Silver (ASX: ASL), Boab Metals (ASX: BML), Investigator Resources (ASX: IVR), Silver Mines (ASX: SVL), Sun Silver (ASX: SS1), Unico Silver (ASX: USL), you will now also find research on Maronan Metals (ASX: MMA), Manuka Resources (ASX: MKR), Mithril Resources (ASX: MTH), and Polymetals Resources (ASX: POL) (Special thanks to my Twitter/X followers for helping pad out the list!).
Why is the silver price rising?
Before we get into the nitty gritty of each ASX silver stock, let’s review some of the factors that are presently helping to drive the silver price higher:
Silver is the new green: The International Energy Agency (IEA) predicts installed power capacity from solar photovoltaic (PV) sources is set to surpass that of coal by 2027 – which would make it the largest contributor to the world's energy mix. The average solar panel produced today uses about 20 grams or roughly 0.64 ounces of silver.
Free float dwindling: Major broker TD Securities predicts there is a structural deficit in the market (i.e., demand versus mine supply) of 140 million ounces per year since the pandemic. Further, it believes the ‘free float’ of copper inventories, that is, silver actually likely to be available for purchase at any time, will have declined to around 311 million ounces by the end of this year. The broker describes this amount as “critically low”.
Chinese demand: Chinese investors are also showing strong demand for silver as a store of value and as an alternative investment to the country’s faltering property market.
The Fed has started a rate cutting cycle: Lower interest rates typically support prices of precious metals as these assets don’t have a yield and they can be expensive to store and insure. This means the opportunity cost of holding silver declines as interest rates decline, making it more attractive to own. There’s also fears more generally that central bank money printing aimed at simulating the sluggish global economy could lead to fiat currency debasement, and this usually supports demand for precious metals like silver and gold.
How high can the silver price go?
Major broker Citi said earlier this week "The setup in silver remains the strongest it has been in a decade”. The broker increased its 6-12 month silver price forecast to $40/oz from $38/oz. This implies around 18.7% upside based upon the current silver spot price at the time of writing of $33.70.
%20COMEX%20chart%2023%20October%202024.png)
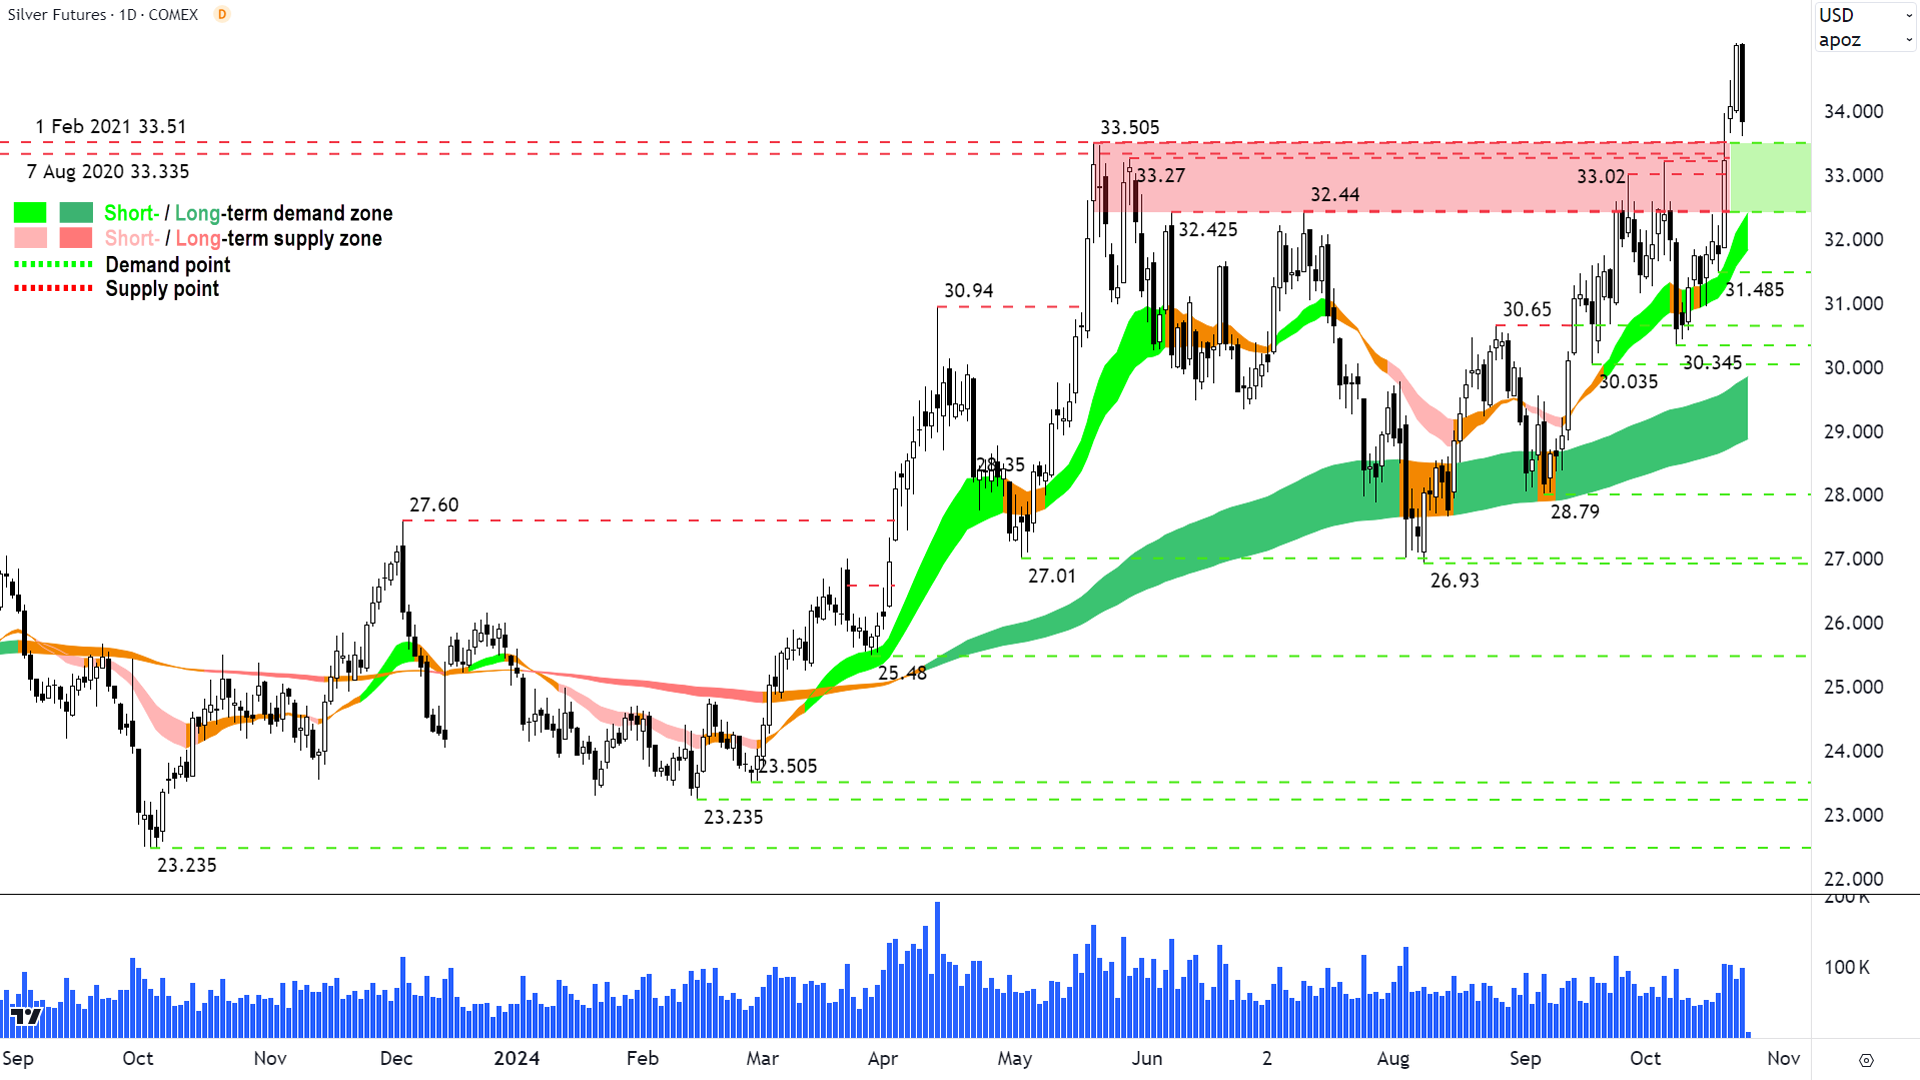
I post regular updates on the silver technicals in my ChartWatch segment of the Evening Wrap I write each day for Market Index. We have been tracking silver’s improving demand-supply dynamics for months now using the COMEX silver futures chart. We had anticipated this most recent break of the critical 32.425-33.505 – itself a remnant of the supply previously predicted at the 1 February 2021 major peak of 33.51.
In the silver futures chart above, I note both short and long term trend ribbons appear to be strongly trending higher, and each is providing dynamic support to the silver price. The price action is rising peaks and rising troughs, and there is a predominance of demand-side candles (i.e., those with white bodies and or downward pointing shadows).
The last candle, however, does show some supply has entered the market within the last 24-hours. It is now up to the demand-side to respond. The most logical place to do so is the now-demand zone of 32.425-33.505. A return to demand-side candles there would likely assist in resuming the broader short and long term uptrends.
Alternatively, a close below 32.425 (as it will also roughly coincide with dynamic demand anticipated at the short term trend ribbon) would end the short term uptrend – and therefore require a more neutral stance in the short-to-medium term.

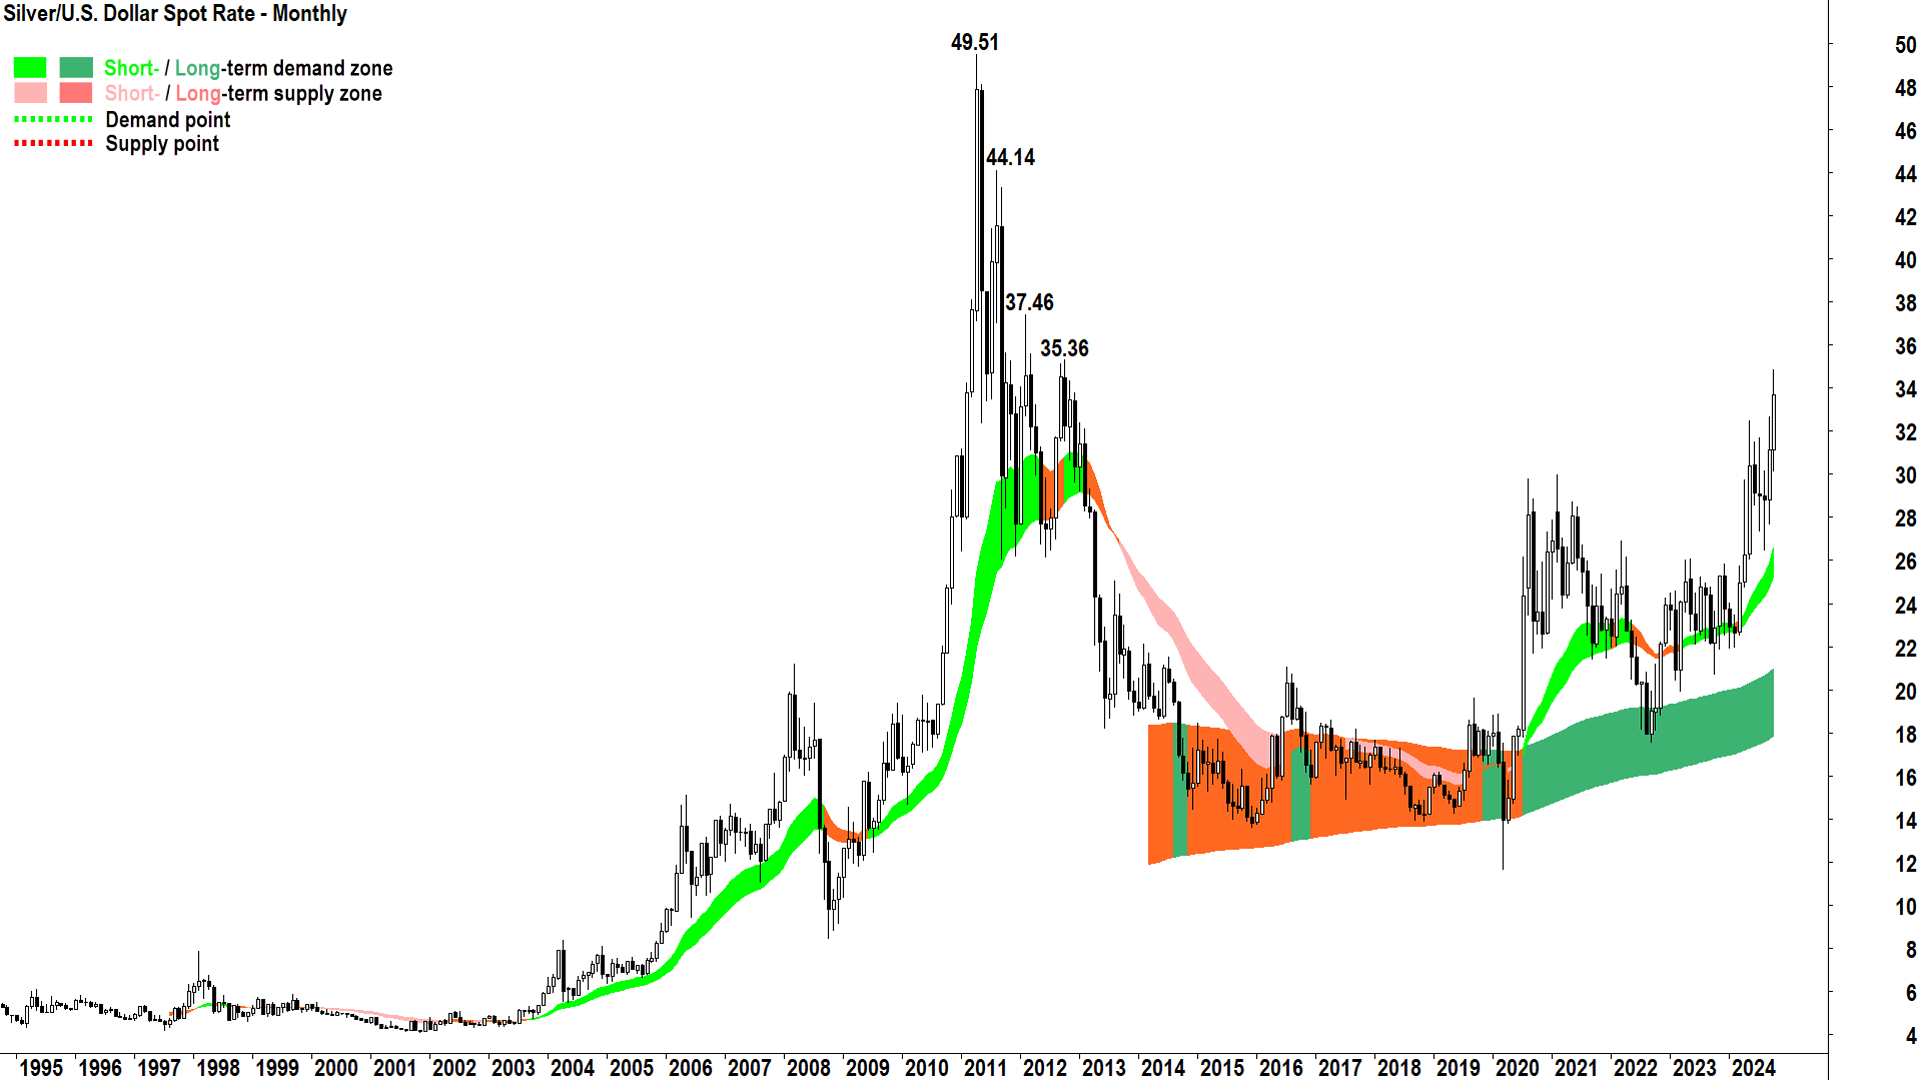
Looking at the bigger technical picture for silver in the monthly chart above, I note similarly strong short and long term trend ribbons. Add to this other technical factors associated with convincing demand-side control such as rising peaks and rising troughs and a predominance of demand-side candles – and again I find no reason to doubt the prevailing trends.
This week’s candle has taken silver above the key historical resistance level of the May peak, and also now convincingly above the 2020-21 peaks. There are potential supply points looming at 35.36 and 37.46, but given their lack of prominence compared to the 49.51 all time high peak, and the fact they are over a decade old – I suspect these will likely be only minor sticking points.
I believe the most logical target here, in time, is 49.51. Today’s weekly close will need to be strong (i.e., near the week’s high) to confirm the current breakout, however, and investors should be attentive at 35.36, 37.46, and 44.14 for signs that excess supply is manifesting itself. Examples of excess supply signals include candles with black bodies and or upward pointing shadows or the setting of a lower peak.
Top 12 ASX Silver Stocks: Explorers, Developers, and Producers
For each ASX silver stock we will consider:
Latest prices / Market Cap: Big or small? How does the market capitalisation of a company compare to the other factors like Stage, Sovereign Risk, Reserves, etc? Is there a potential mispricing / lag behind peers?
What / Where: What is each company doing and where are they doing it? Here, it’s important to consider sovereign risk – projects in stable jurisdictions are less risky than those in jurisdictions where government interference may jeopardise the company’s operation or ownership of the project.
Stage / Next Steps: Is the company merely kicking over rocks in the desert, or is it close to, or actually producing silver? Stocks that are close to mining, or that are currently in production, are more likely to take advantage of the present high silver price. Who knows where the silver price will be in the future!? You may wish to review this article on Stages of Mining Company Development to better understand the importance of this factor.
Reserves: How much silver (and often other minerals) is in the ground? This is usually the hardest information to find as reserves are rarely reported by companies in a consistent way. It’s worth reading this article on How to interpret mining company resources, reserves, and drilling results.
Latest Activity: A one stop shop for the company’s most recent activity, including links to the latest cash flow and activities reports, as well as the most recent company presentation for colour.
Cash in Bank vs Cash Burn: The greatest intentions and upside potential are meaningless without the cash to fund them! How long until the company runs out of cash, and therefore when it will likely need to tap shareholders for more!?
Note that I have deliberately omitted companies like Newmont Mining (ASX: NEM), South 32 (ASX: S32), and Sandfire Resources (ASX: SFR) which are major silver producers, but for which silver contributes only a very small fraction to their net profits. The explorers, developers and producers below are those likely to give you the greatest bang for your buck if the silver price keeps rising.
Adriatic Metals (ASX: ADT)
%20chart%2024%20October%202024.png)
Adriatic Metals price chart
Last Price / Market Cap
$4.08 | $1.3 billion
What / Where
Vares Silver Project, Bosnia & Herzegovina
Raska Zinc-Silver Project, Serbia
Stage / Next Steps
-
Stage: Production
The Vares Silver Project commenced production in early 2024
In September, the company produced approximately 26,000t at 500g/t AgEq
Calendar year 2024 production guidance is approximately 180,000t and calendar year 2025 production guidance is 750,000t-800,000t.
Vares has an estimated 18 years life of mine production, it is expected to produce 15Moz silver equivalent over the first 6 years of operation
-
Next steps:
Vares Project ramp up including at Vares Processing Plant
Ongoing exploration across the portfolio
Reserves
Indicated and Inferred Mineral Resources 83Moz silver, 723Kt zinc, 457Kt lead, 640koz gold, 64kt copper, 24kt antimony
Cash in Bank vs Cash Burn
$58.8 million cash in bank on 30 June
$17.3 million cash burn last quarter
Adriatic says that it’s “fully funded for ramp up to nameplate production” at Vares, from there it predicts it will become a “significant cashflow generating business in 2025 and one of the leading precious and base metal miners in Europe”
Andean Silver (ASX: ASL)
%20chart%2024%20October%202024.png)
Andean Silver price chart
Last price / Market Cap
$1.45 | $227 million
What / where
Cerro Bayo Project, Chile
Stage / Studies / Next Steps
Stage: Exploration (however, given a historical gold/silver mine operated at Cerro Bayo between 1996 and October 2022 when it was placed on care and maintenance, there is significant infrastructure already in place including power and processing including a fully operational 500,000t per annum Ag-Au float plant)
Studies: Nil
-
Next steps:
Resource growth drilling campaigns to proceed through to Q3 2025 with Resource updates intended in Q1 2025 and Q3 2025
Reserves
Indicated and Inferred Mineral Resources 38.6Moz silver (Indicated 6.5Moz and Inferred 32.1Moz)
Also Indicated and Inferred Mineral Resources of 628koz gold (Indicated 60Moz and Inferred 568Moz), results in Indicated and Inferred Mineral Resources 90.7Moz silver equivalent (Indicated 11.5Moz and Inferred 79.1Moz)
Cash in Bank vs Cash Burn
$10.5 million cash in bank on 30 June, but closer to $32.8 million following a $25 million placement to institutional and sophisticated investors in September
~$800,000 per quarter cash burn in FY24
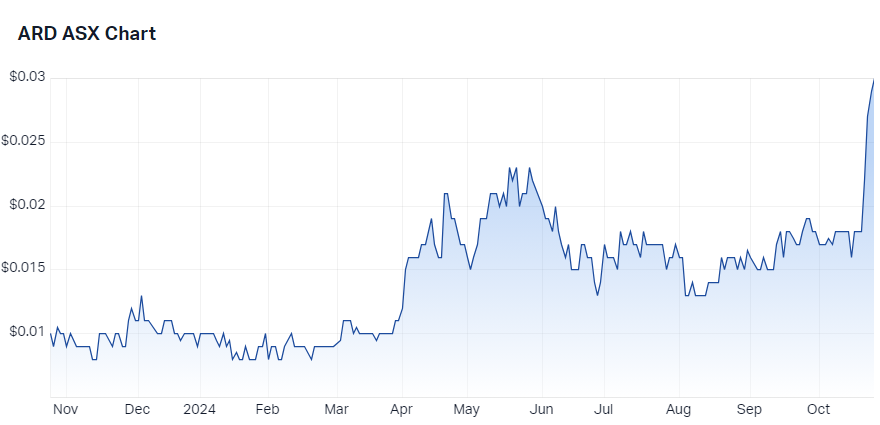
Argent Minerals (ASX: ARD)
%20chart%2024%20October%202024.png)
Argent Minerals price chart
Last Price | Market Cap
$0.03 | $43.3 million
What / Where
Kempfield Project, New South Wales
Stage / Studies / Next Steps
Stage: Exploration
Studies: Nil
Next steps: To "continue to expand the mineralised footprint" at the Kempfield Project, includes “3,000 drill metres anticipated to be completed in the coming weeks”
Reserves
Indicated and Inferred Mineral Resources 65.8Moz silver (30.5Moz Indicated and 35.4Moz Inferred)
Also Indicated and Inferred Mineral Resources gold, lead, and zinc, resulting in Indicated and Inferred Mineral Resources 142.8Moz silver equivalent (60.6Moz Indicated and 82.3Moz Inferred)
Cash in Bank vs Cash Burn
$2.6 million cash in bank on 30 September
$533,000 cash burn in September quarter vs ~$320,000 per quarter cash burn in FY24
Boab Metals (ASX: BML)
%20chart%2024%20October%202024.png)
Boab metals price chart
Last Price / Market Cap
$0.155 | $36.1 million
What / Where
Sorby Hills Lead-Silver-Zinc Project (75% owned), Western Australia
Manbarrum Project, Northern Territory
Stage / Studies / Next Steps
Stage: Exploration and Development
-
Sorby Hills Definitive Feasibility Study:
Pre-tax NPV $411 million @ US$2,255/t lead and $27.40/oz silver
Project life 8.5 years
CAPEX $264 million
AISC unavailable because BML expresses costs for Sorby Hills in terms of lead recovery (C1 cash cost US$0.36/lb payable Pb including net Silver credit of US$0.37/lb silver)
First ore expected December 2026 for first shipment of lead-silver concentrate March 2027
Sorby Hills Front End Engineering Study completed
-
Next steps:
Advancing a drilling campaign at the Sorby Hills Project and the Manbarrum Project
Resource upgrades pending assay results of 43 recent drill holes not yet included in Mineral Resource Estimate (due “fourth quarter”)
Aiming to execute offtake agreements, final environmental approvals, and project financing, with a view to a final investment decision (no timing indicated)
Reach a Final Investment Decision (tipped for “December 2024”)
Reserves
Proved Reserve 14.1Moz silver and 358kt lead and Probable Reserve 5Moz silver and 172kt lead
Measured, Indicated, and Inferred Mineral Resources 53Moz Silver (17.5Moz Measured, 12.1Moz Indicated, and 23.4Moz Inferred)
Also Measured, Indicated, and Inferred Mineral Resources 1,465kt Lead (Measured 444kt, Indicated 377kt, Inferred 645kt), 207kt Zinc (Measured 45kt, Indicated 46kt, Inferred 117kt) resulting in 205Moz silver equivalent
Cash in Bank vs Cash Burn
$4.3 million cash in bank on 3 October
~$900,000 per quarter cash burn in FY24
Investigator Resources (ASX: IVR)
%20chart%2024%20October%202024.png)
Investigator Resources price chart
Last Price / Market Cap
$0.05 | $79 million
What / Where
Paris Silver Project, South Australia.
Stage / Next Steps
Stage: Exploration and Development
-
Paris Mine Pre-Feasibility Study:
Pre-tax NPV $202 million @ $34.30/oz silver
Project life 7 years
CAPEX $131 million
AISC $17.45/oz
-
Next steps:
Definitive Feasibility Study progressing – according to the company “will be released to the ASX in the December Quarter”, but I note in our May update the company promised the DFS was due “mid-2024”
Release of results from the follow up drilling of targets in the Paris regional exploration program
Completion of the final hydrological program at Paris and Hector
Results from the early-stage exploration work within the Curnamona tenement package
Heritage clearance surveys at Curnamona
Targeted RC drilling at Uno-Morgans and Peterlumbo
Reserves
Indicated and Inferred Mineral Resources 57Moz Silver (41Moz Indicated and 16Moz Inferred), 99kt Lead.
Cash in Bank vs Cash Burn
$2.8 million cash in bank on 30 September
~$300,000 per quarter cash burn in FY24
Manuka Resources (ASX: MKR)
%20chart%2024%20October%202024.png)
Manuka Resources price chart
Last Price / Market Cap
$0.055 | $42.8 million
What / Where
Mt Boppy Gold Mine, New South Wales
Wonawinta Silver Mine, New South Wales
Vanadium-rich Iron Sands Resource, New Zealand
Stage / Studies / Next Steps
Stage: Development (Pre-mine restart at Mt Boppy Gold Mine and potentially subsequently, pre-mine restart at Wonawinta Silver Mine)
-
Next steps:
The Company’s current focus is bringing the Mt Boppy Gold Mine back into production in early 2025. Mt Boppy is a brownfields gold mine. A $15.5 million capital cost is required for restart for an initial 3.5 year mine life generating an average EBITDA of $44 million p.a. at an AISC of US$1,116/oz gold according to the company.
It is expected the cashflows from Mt Boppy Gold Mine will assist in funding the restart of the Wonawinta Silver Mine, which the company notes was "Previously Australia’s Largest Primary Silver Mine". Wonawinta Silver Mine has a nameplate capacity ~0.85Mtpa, is fully permitted with plant and all infrastructure operational, the project has been on care and maintenance since 2022. An Ore Reserve update for Wonawinta Silver Mine is "targeted for October 2024".
Reserves
Wonawinta Silver Mine only considered here: Measured, Indicated, and Inferred Mineral Resource 50.94Moz silver (Measured 118Moz, Indicated 18.04Moz, Inferred 31.25Moz) and Measured, Indicated, and Inferred Mineral Resource 207kt lead (Measured 7.5kt, Indicated 102.8kt, Inferred 96.9kt)
Cash in Bank vs Cash Burn
$1.9 million cash in bank at June 30, plus as much as $8 million from a capital raising in September
$1.9 million per quarter cash burn in FY24
Maronan Metals (ASX: MMA)
%20chart%2024%20October%202024.png)
Maronan Metals price chart
Last Price / Market Cap
$0.28 | $56.3 million
What / Where
Maronan silver-lead and copper-gold project, Queensland
Stage / Studies / Next Steps
Stage: Exploration
Studies: Nil
-
Next steps:
Work continues on a revised mining study
Key critical path items required for the grant of a mining lease over Maronan have been initiated including baseline environmental monitoring, infrastructure studies, and stakeholder engagement.
Other advanced mine development studies underway including geotechnical underground mine planning, various metallurgical testing to determine recovery rates, various infrastructure planning, permitting for mining and environmental approvals etc.
Currently drilling a 7,000-10,000m infill program to increase the Indicated Resource
Reserves
Indicated Mineral Resource 118Moz silver, 2,000kt lead, 272kt copper and 760koz gold
Cash in Bank vs Cash Burn
$10.1 million cash in bank at June 30
$1.1 million per quarter cash burn in FY24
Mithril Silver and Gold (ASX: MTH)
%20chart%2024%20October%202024.png)
Mithril Silver and Gold price chart
Last Price / Market Cap
$0.565 | $60.7 million
What / Where
Copalquin Property, Durango State, Mexico
Stage / Next Steps
Stage: Exploration
Studies: Mining Study, Metallurgical studies to test recovery (i.e., various pre-PFS)
Next steps: Drilling is underway, with assays due "over coming weeks and months" according to company, as part of a 9,000m program
Reserves
Indicated and Inferred Mineral Resource 10.9Moz silver (Indicated 2.5Moz and Inferred 8.4Moz) and Measured, Indicated, and Inferred Mineral Resource 373koz gold (Indicated 121koz and Inferred 252koz)
Cash in Bank vs Cash Burn
$1.5 million cash in bank on 30 June
$300,000 per quarter cash burn in FY24
Polymetals Resources (ASX: POL)
%20chart%2024%20October%202024.png)
Polymetals Resources price chart
Last Price / Market Cap
$0.555 | $108 million
What / Where
Endeavor Mine, New South Wales
Stage / Next Steps
-
Stage: Development/Production
Polymetals Resources acquired the operating Endeavor Mine from CBH Resources in August
-
Updated/Optimised Mine Plan completed in August:
10-year Mine Plan: Pre-tax NPV8% = $414m
Free Cashflow = $609m and EBITDA = $89m/annum during first 5 years for 14 month payback period
Payable metal: Zinc 260kt, Silver 10.6Moz and Lead 90kt
Pre-production CAPEX = $28m and Maximum cash drawdown = $30m
Mine restart work has commenced
US$20 million (~A$30 million) pre-payment/loan facility secured
6-year offtake agreement with Ocean Partners for zinc and silver-lead concentrates produced from the Endeavor Mine (Zinc: 50% Benchmark and 50% at Spot References, Silver-Lead: Benchmark for high silver concentrates)
-
Next steps:
Ramp up planned refurbishment works, recruitment of key management personnel
Targeted first concentrate production and and sales revenue in "H1 2025" according to company
Reserves
Measured, Indicated, and Inferred Mineral Resource 44.2Moz silver (Measured 13.2Moz, Indicated 23.2Moz, Inferred 7.8Moz), , Measured, Indicated, and Inferred Mineral Resource 1.3Mt zinc (Measured 370kt, Indicated 700kt, Inferred 240kt), Measured, Indicated, and Inferred Mineral Resource 730kt lead (Measured 220kt, Indicated 400kt, Inferred 110kt)
Cash in Bank vs Cash Burn
$4.5 million cash in bank on 30 September
$1.5 million cash burn in September quarter vs $250,000 per quarter cash burn in FY24
Silver Mines (ASX: SVL)
%20chart%2024%20October%202024.png)
Silver Mines price chart
Last Price / Market Cap
$0.135 | $203 million
What / Where
Bowdens Silver Project (silver/polymetallic), New South Wales
Barabolar Project (copper/gold/silver), New South Wales
Tuena Project (gold/silver), New South Wales
Stage / Studies / Next Steps
Stage: Exploration and development
-
Bowdens Silver Project Pre-Feasibility Study (Feasibility Study):
Pre-tax NPV $144 million @ $22/oz silver
Life of mine 16.5 years @ 5Moz Silver equivalent per annum over the first 8-yrs
CAPEX $246 million
AISC $17.25
-
Next steps:
Definitive Feasibility Study (referred to as "Feasibility Optimisation Study" by the company) progressing – according to the company is "anticipated to be finalised in H2 2024" (Note that in May this was stated as “targeted for release in the September Quarter”, but the the company has had significant issues with a challenge to the NSW Planning Commission's 2023 development approval for the project. The challenge, made by Bingman Catchment Landcare Group in the New South Wales Supreme Court, Court of Appeal means that "development consent for the project can no longer be relied upon by the company" according to SVL (16 Aug). SVL is now working through the steps required by the NSW Department of Planning Housing and Infrastructure "to achieve reinstatement of the consent, in a way that would satisfy the Court's concerns in relation to the assessment of the transmission line to provide power to the proposed mine site" (14 Oct))
Ongoing exploration across the portfolio
Reserves
Measured, Indicated, and Inferred Mineral Resources 189Moz silver (Measured 137Moz, Indicated 33Moz, and Inferred 19Moz)
Also zinc, lead, and gold resources resulting in Measured, Indicated, and Inferred Mineral Resources 396Moz silver equivalent (235oz Measured, 88Moz Indicated, and 73Moz Inferred)
Cash in Bank vs Cash Burn
$10.8 million cash in bank on 30 June
$660,000 per quarter cash burn in FY24
Sun Silver (ASX: SS1)
%20chart%2024%20October%202024.png)
Sun Silver price chart
Last Price / Market Cap
$1.02 | $86 million
What / Where
Maverick Springs silver project in Elko County, Nevada.
Stage / Studies / Next Steps
Stage: Exploration
Studies: Nil
-
Next steps:
Mine optimisation studies utilising current day data and economics
Expansion exploration drilling to the north and south of the current resource, targeting shallow high-grade ounces
Infill drilling to increase resource classifications
Metallurgical Test Work
Silver Paste & Solar Energy Investigations
Reserves
Inferred Mineral Resources 253.3Moz silver and 2Moz gold for 423Moz silver equivalent
Cash in Bank vs Cash Burn
$11.6 million cash in bank at June 30, plus as much as $13 million raised in a capital raise/strategic investment in September
$500,000 cash burn in July quarter, the company's first full quarter of operating since listing
Unico Silver (ASX: USL)
%20chart%2024%20October%202024.png)
Unico Silver price chart
Last price / Market Cap
$0.34 | $120 million
What / where
Cerro Leon Project, Argentina
Joaquin Project, Argentina
Stage / Studies / Next Steps
Stage: Exploration
Studies: Maiden Resource Estimate
-
Next steps:
Drilling at Cerro Leon will comprise an initial 5000m reverse circulation drill program followed by diamond drilling aimed at expanding the Project’s current Mineral Resource Estimate. Six prospects where silver mineralisation is open at depth or along strike are prioritised for drilling, including several new areas that fall outside of the current MRE
First assay results are expected mid-December
Reserves
-
At Cerro Leon:
Indicated and Inferred Mineral Resources 40.9Moz silver (Indicated 18.8Moz and Inferred 22.1Moz)
Also Inferred Mineral Resources of 344.2koz gold, 129kt lead, and 332kt Zinc results in Indicated and Inferred Mineral Resources 91.3Moz silver equivalent (Indicated 37.7Moz and Inferred 53.6Moz)
-
At Joaquin:
Measured, Indicated and Inferred Mineral Resources 68.3Moz silver (Measured and Indicated 65.2Moz and Inferred 3.1Moz)
Also Measured, Indicated and Inferred Mineral Resources 64.2koz gold (Measured and Indicated 61.1Moz and Inferred 3.7Moz)
Cash in Bank vs Cash Burn
$5 million cash in bank on 30 June, but closer to $11 million following a $8 million placement in August, less $2 million upfront payment for Joaquin acquisition
$650,000 per quarter cash burn in FY24
This article first appeared on Market Index on Thursday 24 October 2024.
Never miss an update
Enjoy this wire? Hit the ‘like’ button to let us know.
Stay up to date with my current content by
following me below and you’ll be notified every time I post a wire
Carl has over 30-years investing experience and has helped investors navigate several bull and bear markets over this time. He is a well respected markets commentator who specialises in how the global macro impacts Australian and US equities. Carl has a passion for technical analysis and has taught his unique brand of price-action trend following to thousands of Aussie investors.
........
Investing is risky. Inevitably you will endure losses. If you can't cope with losing, don't invest.

%20COMEX%20chart%2023%20October%202024.png)
5 topics
12 stocks mentioned

Carl has over 30-years investing experience and has helped investors navigate several bull and bear markets over this time. He is a well respected markets commentator who specialises in how the global macro impacts Australian and US equities. Carl...
Carl has over 30-years investing experience and has helped investors navigate several bull and bear markets over this time. He is a well respected markets commentator who specialises in how the global macro impacts Australian and US equities. Carl...
Comments
Comments
Sign In or Join Free to comment